
Why you shouldn’t try to time the top of the market


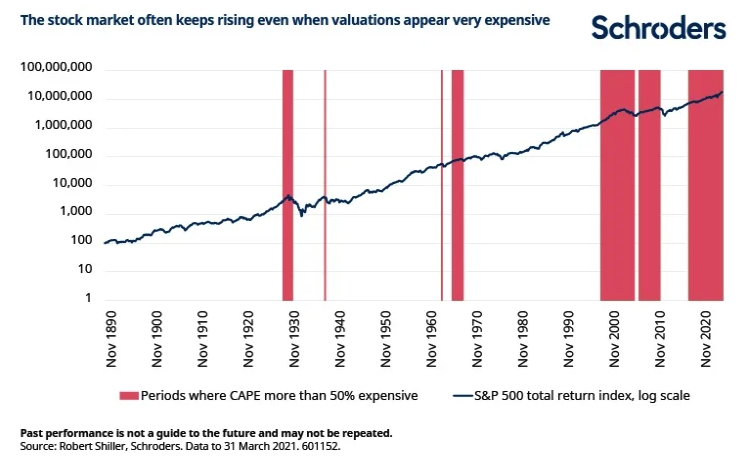
At the end of March, the S&P 500 index of US large companies was valued at 34 times its earnings over the past 12 months. This is more expensive than at the peak of the dotcom bubble at the end of 1999, when the figure was 31 times.
And it’s a long way above the five-decade average of 17 times.
You could justifiably argue that the last 12 months has been distorted by the pandemic, so this isn’t a fair comparison.
But it’s a similar story if we compare share prices with earnings smoothed over a longer horizon. We can do this with the cyclically-adjusted price earnings multiple, also known as CAPE, or the Shiller PE, after the academic, Robert Shiller, who invented it.
CAPE compares prices with average earnings over the previous ten years, in inflation-adjusted terms.
At the end of March the US stock market was trading on a CAPE of 36. The 140 year historical average is 17. The only time in history it has been higher was at the apex of the dotcom boom.
Discover more from Schroders:
– Learn: The £19k cost of trying to time the market
– Read: The world according to “QARP”
– Watch: The telecoms business which pioneered a payment system lifting thousands out of poverty
Is it best to sell then?
It’s your decision and you have options. You could certainly make a strong case for cashing in your chips. But it’s painfully tough over the years to identify market tops. Our research shows that shifting fully out of stocks on the basis of intimidating valuations has been a losing strategy for some in the past. You could temper your exposure perhaps, but drastic actions can have drastic consequences for your future wealth.
How much could I have lost selling too early?
Let’s assume you’re an investor in the US stock market. And that you get the heebie-jeebies whenever the market valuation is more than 50% expensive than its experience to date – a fair assumption for most people. Whenever this happens you sell your shares. And you buy back into the market when valuations are no longer more than 50% expensive.
How would this work out as a strategy? Not well.
If you made these decisions based on the CAPE multiple, you’d have been out of the stock market since 2013, bar a few scattered months. You’d also have sat out, not just the later stages of the dotcom bubble, but also the earlier years. And most of the years in the run-up the financial crisis.
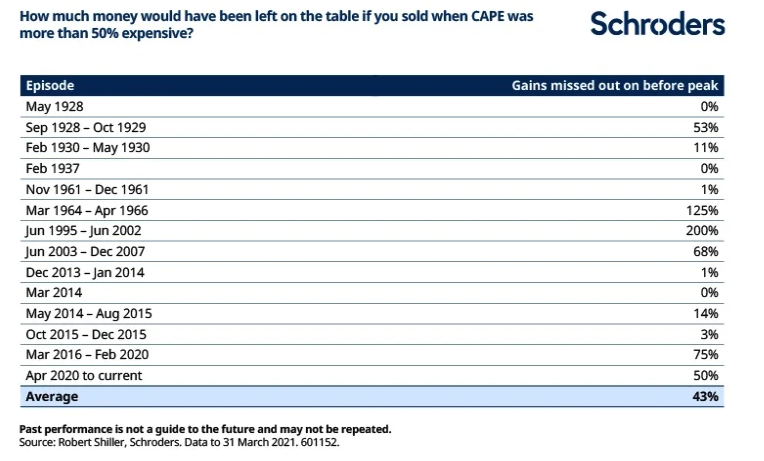
The table below shows how much return you’d have left on the table if you’d followed this strategy during each episode of apparently super-expensive valuations. Some are very short, with six lasting three months or less.
On average, investors would have lost out on potential gains of 43% by selling too early.
In the past, the market kept rallying for an average of 17 months before peaking. It is 12 months in this time around.
But does selling help avoid losses?
Just because the market kept rising, it doesn’t mean investors would have been able to capture all of those gains. All bull markets turn sour eventually. And if you’d stayed invested then you’d have been exposed to any downturn, which you could have avoided by selling.
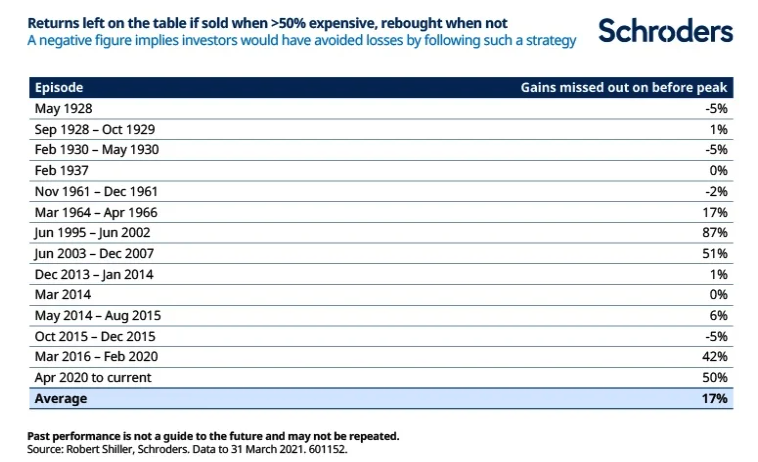
But our analysis suggests that, on average, any losses avoided would have been insufficient to make up for the gains missed out on.
In 10 of 14 cases, the US market delivered a positive return over the period when it was more than 50% expensive (the two figures showing as 0% are small positive returns that have been rounded down). This is after allowing for any falls from the peak. In a number of cases, very high returns would have been earned.
And even in those cases where losses would have been incurred, they would have been fairly minimal.
Counting the cost
In return terms, the strategy which stayed invested throughout would have returned 9.7% a year over the past 130 years. This is compared with 7.4% a year for the one which shifted to cash (assuming cash is invested in Treasury bills and ignoring any transaction costs). Over such a long horizon, this 2.3% a year addition compounds up to a very large difference.
$100 in the switching strategy in 1890 would now be worth $1.1 million. Pretty good. But $100 in the one which stayed invested would now be worth $18.1 million.
The usual caveats about past performance not being a guide to the future apply but this highlights just how hard, and potentially costly, it has been to try to call the top of the market.
The punchline
It’s rarely a good idea to sell your shares just because the market appears expensive. It can get more expensive. It can even get cheaper without having to fall (all else being equal, a rebound in earnings, as is forecast this year, will result in a cheapening of earnings-based measures of valuation).
That doesn’t mean you should ignore valuations; they can be a powerful tool when assessing long term returns and they are at historically extreme levels right now. But also be aware of their limitations – consider a broader range of factors.
And balance the scale of your response with your conviction – and your investment goals, risk tolerance and investment horizon. You might consider reducing your equity allocation if you are worried. Or you might think about reallocating money to areas where valuations appear less stretched – such as markets outside of the US, or “value” equities. But making a bold call to sell everything is really hard to time right.
Remember – when you read stories about people who correctly called the market top in the past, you are reading about the survivors. Not the many who tried and failed. Be humble about your ability to do this successfully.
Topics:
– For more visit Schroders insights and follow Schroders on twitter.
Important Information: This communication is marketing material. The views and opinions contained herein are those of the author(s) on this page, and may not necessarily represent views expressed or reflected in other Schroders communications, strategies or funds. This material is intended to be for information purposes only and is not intended as promotional material in any respect. The material is not intended as an offer or solicitation for the purchase or sale of any financial instrument. It is not intended to provide and should not be relied on for accounting, legal or tax advice, or investment recommendations. Reliance should not be placed on the views and information in this document when taking individual investment and/or strategic decisions. Past performance is not a reliable indicator of future results. The value of an investment can go down as well as up and is not guaranteed. All investments involve risks including the risk of possible loss of principal. Information herein is believed to be reliable but Schroders does not warrant its completeness or accuracy. Some information quoted was obtained from external sources we consider to be reliable. No responsibility can be accepted for errors of fact obtained from third parties, and this data may change with market conditions. This does not exclude any duty or liability that Schroders has to its customers under any regulatory system. Regions/ sectors shown for illustrative purposes only and should not be viewed as a recommendation to buy/sell. The opinions in this material include some forecasted views. We believe we are basing our expectations and beliefs on reasonable assumptions within the bounds of what we currently know. However, there is no guarantee than any forecasts or opinions will be realised. These views and opinions may change. To the extent that you are in North America, this content is issued by Schroder Investment Management North America Inc., an indirect wholly owned subsidiary of Schroders plc and SEC registered adviser providing asset management products and services to clients in the US and Canada. For all other users, this content is issued by Schroder Investment Management Limited, 1 London Wall Place, London EC2Y 5AU. Registered No. 1893220 England. Authorised and regulated by the Financial Conduct Authority.