UK immigration map: Is there room for more?

In the run up to the general election, there will be a lot of talk about immigration. One argument bandied around is that, as a relatively small island, there just isn’t enough room for newcomers.
Anti-establishment party Ukip is trading on its promises to cut immigration, forcing the Conservatives to get tougher. Anti-immigration arguments have often centred around the strain on the labour market and public services, but there are those who just claim there isn't enough space. They're wrong.
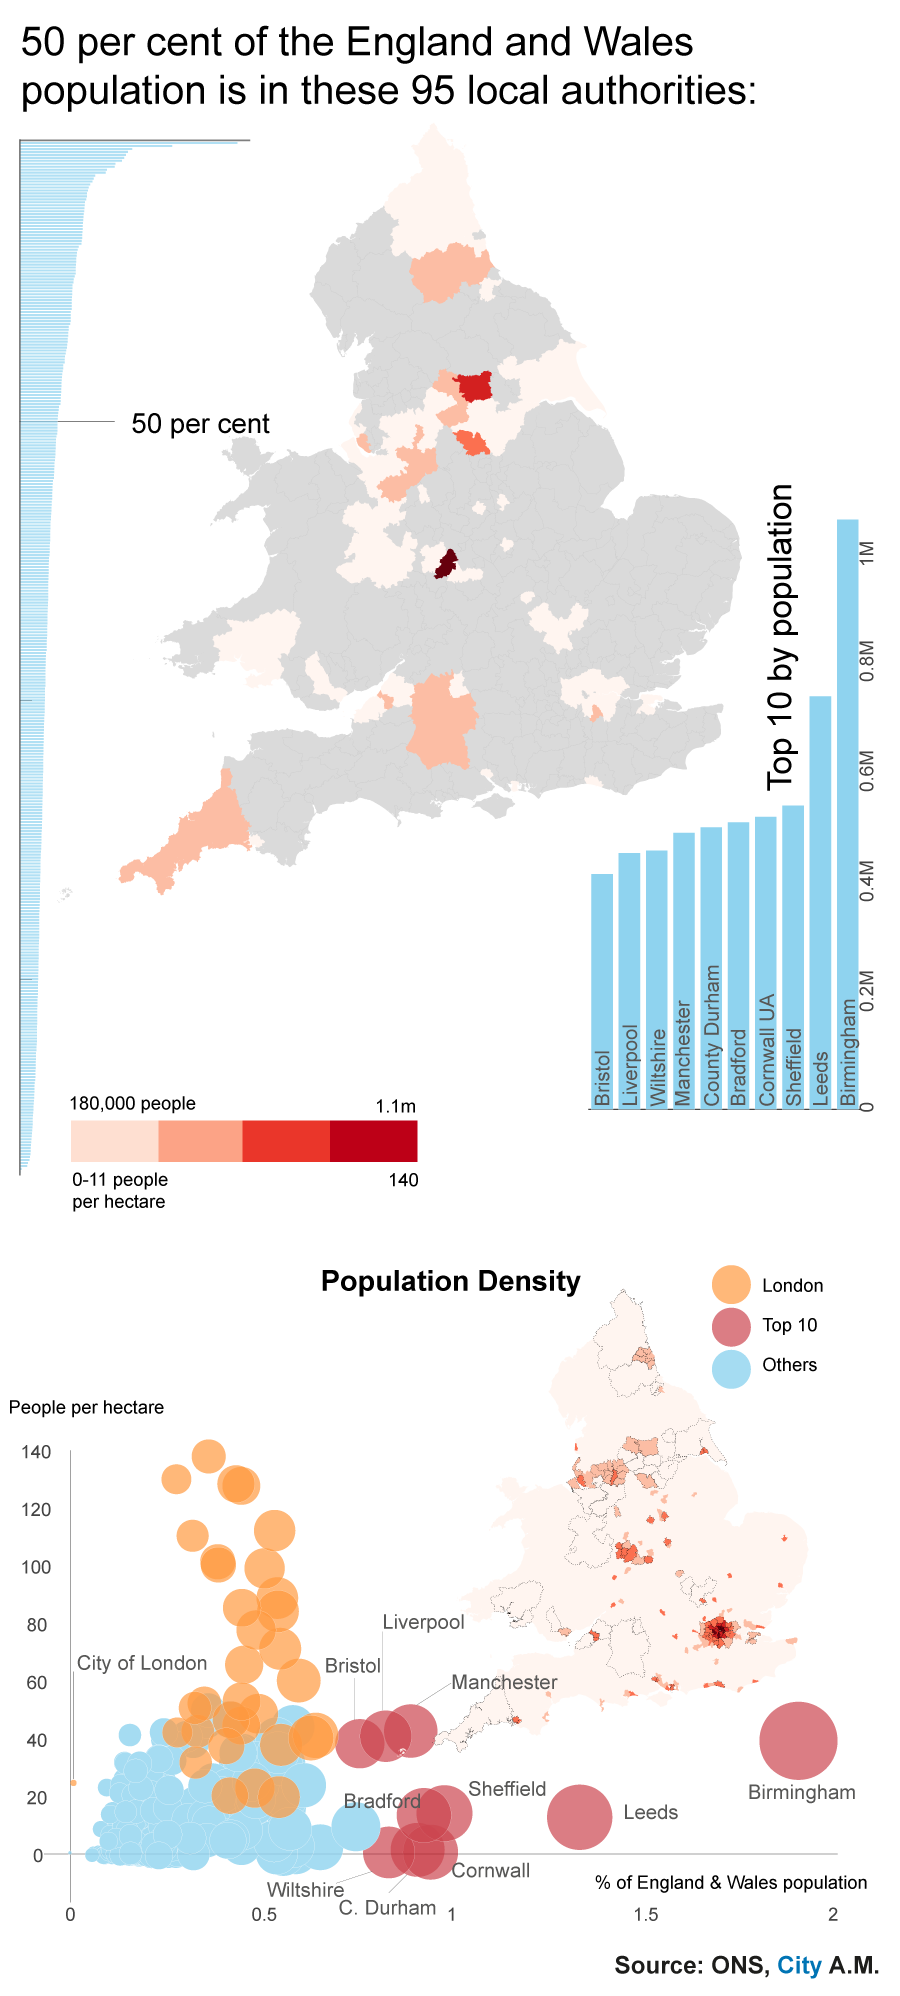
In England and Wales, 50 per cent of the population lives in just 27 per cent of the local council areas, and lives on only 10 per cent of the country’s surface area. As Stephen Nickell of the Office for Budget Responsibility says, there is plenty of room:
One argument said we’re a small island, not much room. On the other hand, of course, there’s masses of room. The urbanised part of Britain occupies less than 10 per cent of the surface area. The urbanised part of Surrey occupies less of Surrey than golf courses.
The first map above shows the 95 most populous areas, while the second shows the population density across the UK. The structure of the UK’s local government means the cities such as Birmingham are controlled by a single tier government, while London is broken down by boroughs.
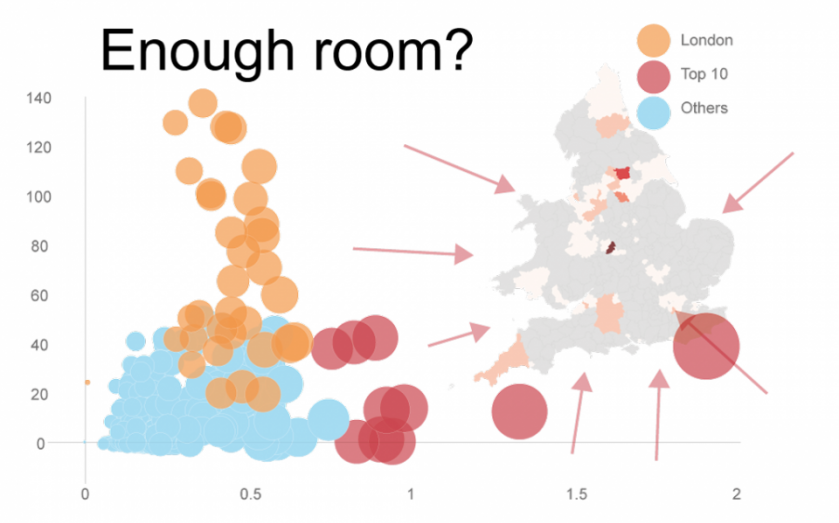
The bubble graph at the bottom of the graphic shows local authorities by percentage of the England and Wales population, charted against the population density. The size of the bubbles represents the first of those two values. London boroughs are concentrated towards the low population end of the scale, but are high up as their density is greater, as you’d expect.
