Six charts showing why the UK needs to build more homes

The housing market is hotly watched recently with prices rising and demand under constant observation.
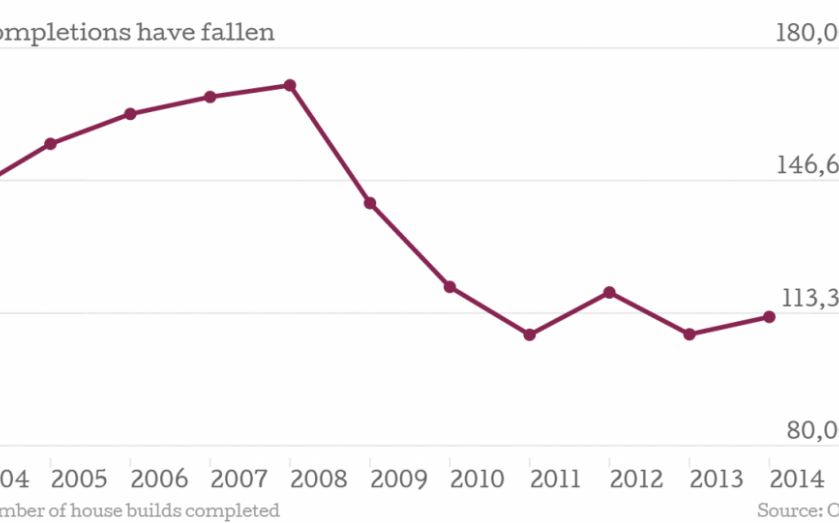
There were 21.9 per cent fewer house completions in England during 2013/14 than there were in 2003/4, while demand for house in London has driven the average price north of £500,000.
These are just some of the results of analysis carried out by the Office of National Statistics (ONS) which also shows an increase in the proportion of privately rented dwellings in the housing stock as price to earnings ratios climb across the country.
The annual report is aimed at ensuring that both policy makers and the public get the correct information on the market.
The UK housing market is a significant part of the economy, with 27.8m residential properties across the constituent countries. The markets differ somewhat between England, Wales, Scotland and Northern Ireland.
So what is the state of the market?
We aren't building as many houses
The ONS identified the number of completions as a long-term downward trend, which is something politicians have been arguinga bout for some time. Suggestions to solve the problem have included taxing the land banks of house builders and building Garden Cities. What ever the solution, the problem is clear, as the graph at the top of the page shows.
Completions may have fallen in England, but they have fallen by even greater percentages in Scotland, Wales and Northern Ireland since 2003/04:

Houses are becoming more expensive:
ONS data recently showed that the average cost of a house in London had edged above £500,000 for the first time. Other non-official measures have the figure even higher, but the ONS is likely to be more accurate. Most regions are now around their pre-crisis peak but the report states:
The two notable exceptions to this are Northern Ireland, whose prices are roughly half of their pre-financial crisis peak, and London which has seen an increase of around a third. The rise in house prices since the turn of the century has also had effects on affordability, which has decreased over time.


The proportion of privately rented dwelling stock is higher in England than in any other country and has been from at least financial year 2000/01 where this type of tenure made up 10 p[er cent of overall dwelling stock to financial year 2011/12 where it represented 18.6 per cent of dwelling stock. At 4.29 million units, this is the highest recorded level of private rented units since 1961.

While the overall level of dwelling stock has increased, the number of houses built in the UnitedKingdom continues on a long term downward trend. Again, variation exists within the UK, with Northern Ireland completing houses at over double the per capita rate of Wales and England.