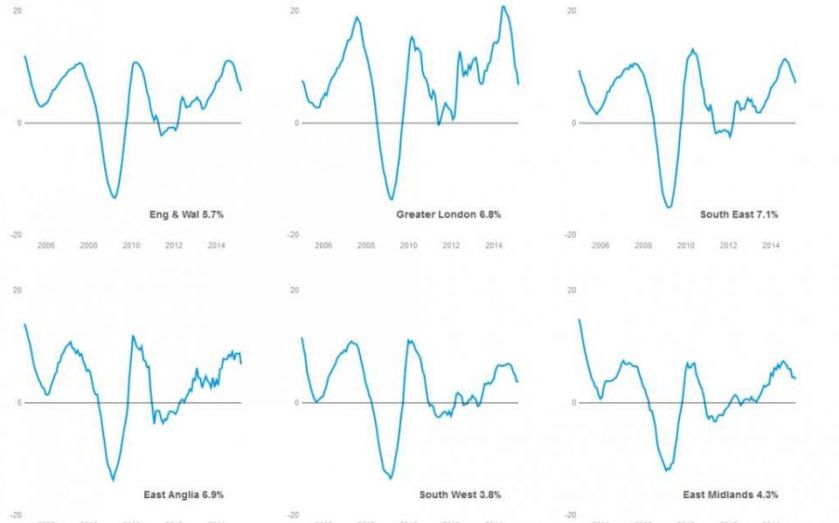
UK house prices in charts: Growth in London is beaten by other regions for the first time in 53 months

London has been knocked off its perch as the region with the fastest-growing house prices for the first time in 53 consecutive months, or nearly four and a half years.
Annual house prices, on average, grew by 6.8 per cent in the three months to the end of April, falling behind both the south east (7.1 per cent) and East Anglia (6.9 per cent), according to figures from Acadata.
The data comes on the same day rental figures from Homelet reveal London rental price growth has fallen behind too.
London’s annual growth has slowed dramatically: it was at nine per cent in the three months to February. The average cost of a house in the capital is still the highest in the country at £555,690, compared to £275,961 for the UK as a whole.
The charts below show how house prices have changed in every region since 2005, by three-month, annual percentage change. Regions charted in red have house price growth slower than London’s. Hover over the lines (tap on mobile) to compare house prices across regions for any date.
If you have trouble viewing, please refresh the page and wait for it to stop loading before hovering (tapping on mobile).
[custom id="19"]