The death of yields in six charts

There has been a relentless downward move in global bond yields since the 2008 Global Financial Crisis. This trend – underpinned by highly supportive central bank policies and stubbornly low inflation – has been a defining characteristic of the post-crisis world.
Another defining trait of this period, and a landmark for financial markets, has been the emergence of negative yields.
Though it may be difficult for some investors to fathom, it is exactly as it sounds: a significant proportion of bonds now pay a yield of below zero and holding these bonds to maturity results in a guaranteed loss. It means investors are paying for the privilege of lending money to borrowers.
Not long ago it would have seemed improbable that an investor would willingly agree to this. However, in August the sum total of negative yielding bonds across the globe reached $17 trillion.
Here, we highlight a number of other negative and ultra-low yield milestones reached in August.
The majority of eurozone government bonds have become negative yielding
Europe has seen mediocre growth and low inflation for some time and also one of the boldest central bank policy responses. While unusually low yields are seen across the globe, it is in Europe where the phenomenon of negative yields is most evident.
In August the entire yield curves – that is, bonds of all lengths of maturity – of Switzerland and Germany moved below zero. This included Switzerland’s 50-year bond. Austria’s 50-year bond yield benchmark traded as low as 0.3 per cent. Germany was even able to issue a new 30-year bond, raising over €800 million, paying zero interest.
More recently, Greece, once the epicentre of the eurozone debt crisis and the pariah of the bond markets, issued a three-month bond with a yield of -0.02 per cent.


The convergence between yields of different maturities is remarkable. Received wisdom holds that longer-dated bonds should offer a “term premium”, or extra yield, above the yield on offer from shorter-maturity bonds. This is to compensate for committing money for a longer period of time and the added risk that entails – the longer the term of an investment the more chance there is of an unforeseen negative occurrence. This premium has substantially reduced in Europe.
There will always be some “natural demand” for government bonds, investors will often use them to counterweight riskier holdings such as stocks. The extent of these moves points to something deeper.
For related content try the articles below:
– What happens to high yield bonds in times of market stress?
– Investment returns of 6% or 11%: who’s right?
– Fallen angels: why passive investors may face greater risks
The implication seems to be that investors consider the prospect of a certain relatively small loss as preferable to risking larger losses elsewhere. That they are prepared to take this view as far out as 30, 50 and even 100 years (as we shall see in the next section) shows just how uncertain they see the economic and investment outlook.
Bonds are effectively a proxy for investors’ assessment of the possibility of growth, inflation and therefore interest rates either rising or falling in the future. If bonds are in demand at low yields, the implication is that investors see little prospect of rising inflation or rates. In fact, negative yields suggest investors think rates need to fall, which means they see a risk of deflation, whereby prices of goods and services fall.
Austria’s 2 per cent century bond
Austria issued a 100-year bond on 20 September 2017, so it will mature on the same date in 2117, with a yield of 2.1 per cent. A 100-year bond issue is noteworthy enough. That the Austrian government had only to offer just over 2 per cent to attract investors is especially telling.
Like many European government bonds, it has seen strong demand in 2019, with the yield falling from 1.75 per cent to 0.62 per cent (as at 27 September). Bond prices and yields move inversely of one another. The total return of the bond year to date is over 60 per cent.
That investors are prepared to commit their money for 100 years at such a low rate underlines the erosion of term premium and how uncertain investors find the world at present.

Ten-year corporate bond trades on below-zero yield
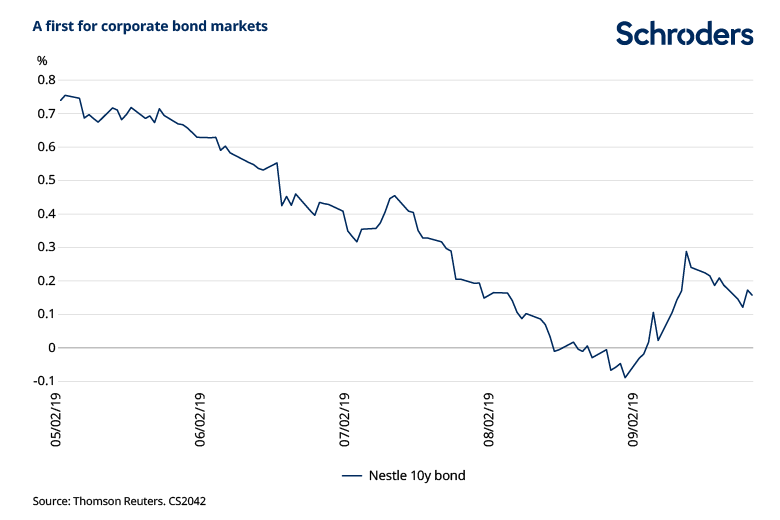
A Nestle 10-year corporate bond became the first on record to trade with a yield of below zero. The bond is due to mature on 2 November 2029, having been issued on the same date in 2017 with a yield of 1.25 per cent. Nestle, a large multinational food producer headquartered in Switzerland, is AA rated by the three major ratings agencies, the second highest credit rating.

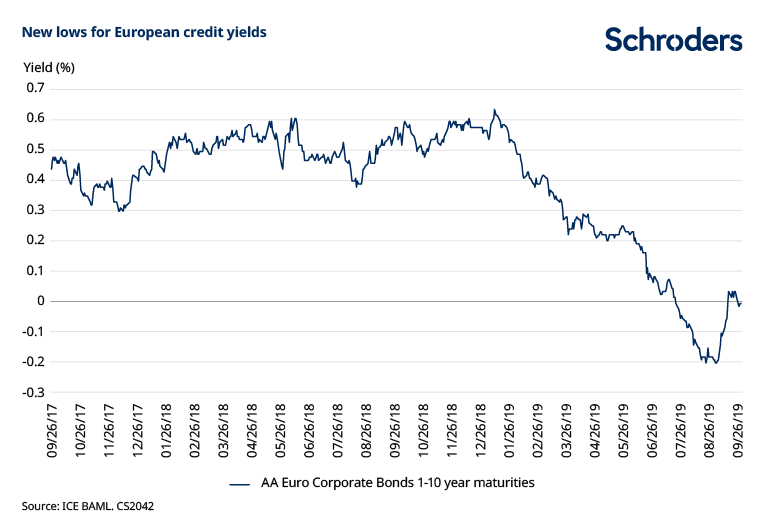
The AA-rated European corporate index also went below zero overall, with instances of six and seven-year maturity bonds at negative yields.

US yield curve inversion
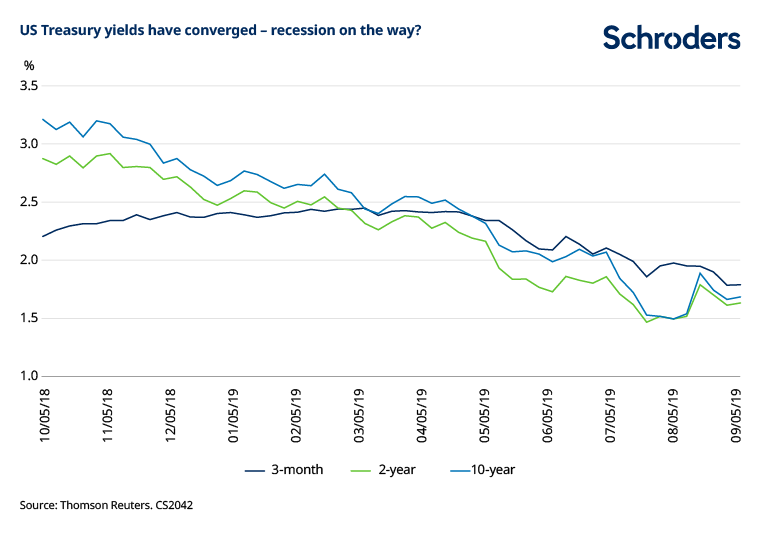
The inversion of the US yield curve has been well covered. It is regarded as one of the most reliable predictors of recessions. Every time the 10-year yield has fallen below the two-year a recession has not been too long behind. This occurred, albeit briefly, in August. The three-month US yield has been higher than the 10-year since May.

Please note for all charts past performance is not a guide to future performance and may not be repeated. The value of investments and the income from them may go down as well as up and investors may not get back the amounts originally invested. Exchange rate changes may cause the value of any overseas investments to rise or fall.
How did this happen and what does it mean for investors?
A major cause of low yields is the massive monetary support from central banks that has followed the 2008 crisis. Not only very low policy interest rates, but also large-scale money printing, then used to buy bonds and other financial instruments.
In Europe, over a period of 45 months ending December 2018, the central bank purchased €1.9 trillion of government bonds, or 90 per cent of the bonds issued by governments across the region. The European Central Bank (ECB) purchased the bonds through the national central banks, which now hold some 15 per cent of total public debt, up from 4 per cent.
Inflation has remained below central bank targets in many countries for much of the post-crisis period despite strong levels of employment. Central bank policy has been a direct attempt to address this due to the risk that prices and economic growth could stagnate or start to fall.
The significant year-to-date decline in yields was widely attributed to the Federal Reserve’s change in tone early in the year, when it unexpectedly started to suggest that rates could fall. Added to this, growth has started to slow, not helped by the US and China implementing tariffs on each other. And indeed, there is broadly more uncertainty as to what economic and foreign policies governments may follow now, particularly the US. This sort of uncertainty tends to drive investors towards safer assets like government bonds.
Important Information: This communication is marketing material. The views and opinions contained herein are those of the author(s) on this page, and may not necessarily represent views expressed or reflected in other Schroders communications, strategies or funds. This material is intended to be for information purposes only and is not intended as promotional material in any respect. The material is not intended as an offer or solicitation for the purchase or sale of any financial instrument. It is not intended to provide and should not be relied on for accounting, legal or tax advice, or investment recommendations. Reliance should not be placed on the views and information in this document when taking individual investment and/or strategic decisions. Past performance is not a reliable indicator of future results. The value of an investment can go down as well as up and is not guaranteed. All investments involve risks including the risk of possible loss of principal. Information herein is believed to be reliable but Schroders does not warrant its completeness or accuracy. Some information quoted was obtained from external sources we consider to be reliable. No responsibility can be accepted for errors of fact obtained from third parties, and this data may change with market conditions. This does not exclude any duty or liability that Schroders has to its customers under any regulatory system. Regions/ sectors shown for illustrative purposes only and should not be viewed as a recommendation to buy/sell. The opinions in this material include some forecasted views. We believe we are basing our expectations and beliefs on reasonable assumptions within the bounds of what we currently know. However, there is no guarantee than any forecasts or opinions will be realised. These views and opinions may change. To the extent that you are in North America, this content is issued by Schroder Investment Management North America Inc., an indirect wholly owned subsidiary of Schroders plc and SEC registered adviser providing asset management products and services to clients in the US and Canada. For all other users, this content is issued by Schroder Investment Management Limited, 1 London Wall Place, London EC2Y 5AU. Registered No. 1893220 England. Authorised and regulated by the Financial Conduct Authority.
