Six graphs that explain the UK economy ahead of Bank of England’s interest rate decision
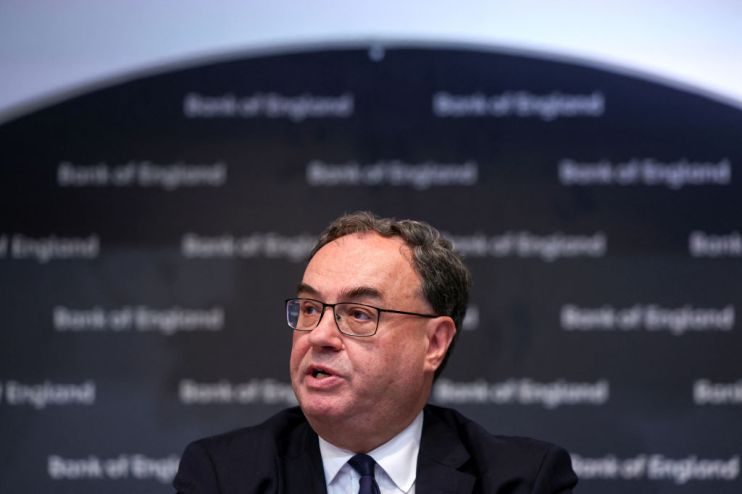
Next week the Bank of England will meet for the first time this year for its latest decision on interest rates.
It is all but certain that interest rates – which stand at a post-financial crisis high of 5.25 per cent – will be left on hold for now, but looking further into the year there is more debate.
Markets are convinced that a rate cut is coming, likely in the first half of this year. So far, the Bank has not been persuaded.
So what are the relevant pieces of data which can help explain where the UK economy stands right now?
Inflation
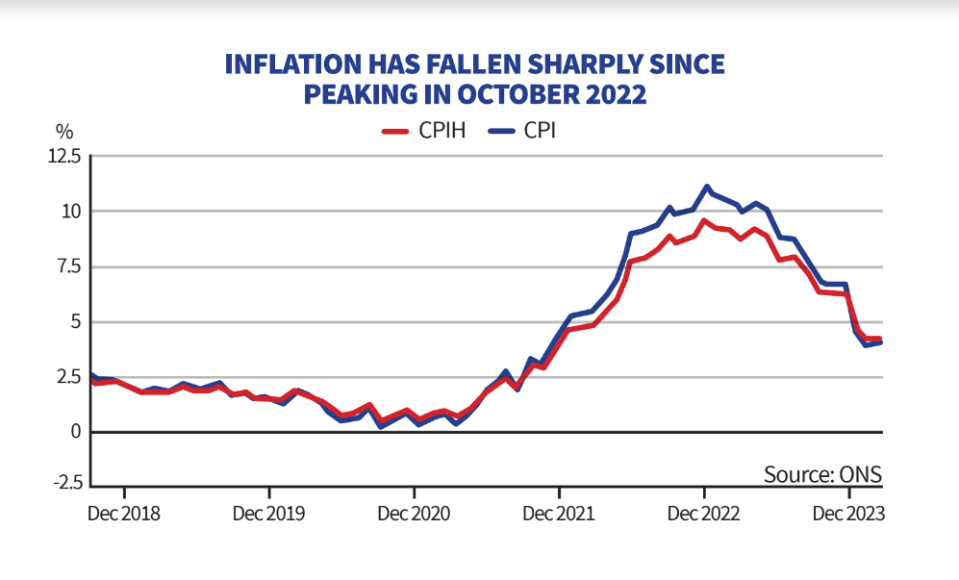
Despite the surprise uptick in December, inflation still dropped remarkably quickly in the final quarter of last year.
In November, the Bank of England forecast that inflation would only have fallen to 4.6 per cent by the end of 2023, but – helped by easing food inflation and falling energy prices – it has already dropped to four per cent.
With experts predicting another hefty fall in the energy price cap in April, inflation could hit the two per cent target by the Spring. So what is the Bank waiting for?
Services inflation (like inflation, but maybe more important)
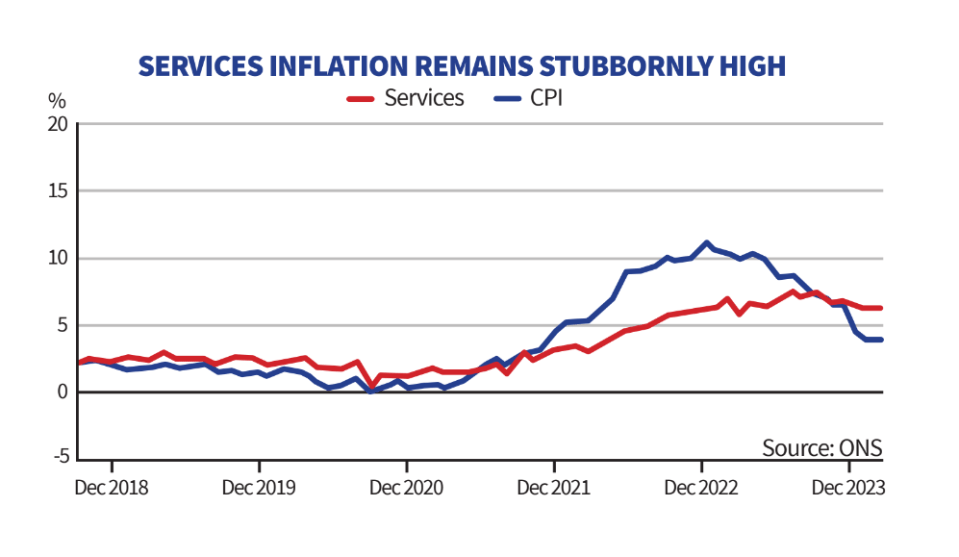
One of the Bank’s main concerns is the persistence in services inflation. The UK’s service sector dominates the economy and is seen as a more accurate gauge of domestically generated price pressures.
In December, services inflation actually increased to 6.4 per cent from 6.3 per cent. This may not sound like a big increase, but the Bank won’t want to see one bad month turn into a trend.
But despite December’s increase, services inflation is comfortably below the 6.9 per cent projected in the Bank’s November forecast.
Wage growth
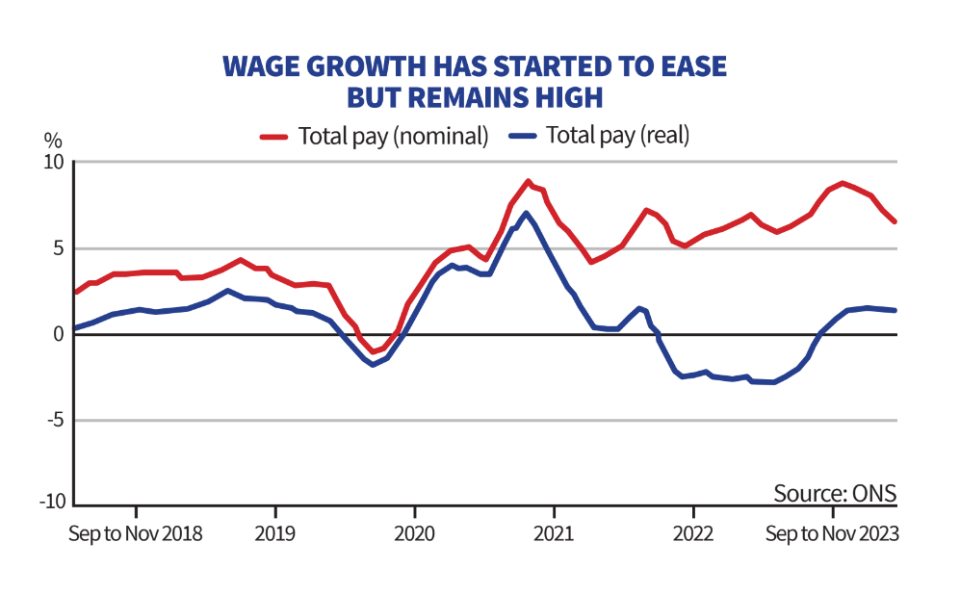
Wage growth is another one of the Bank of England’s key concerns. If wage growth remains high – around six or seven per cent – then its very unlikely that inflation will fall to the two per cent target, because people will have more money to spend.
The latest figures show that average annual wage growth fell to 6.5 per cent between September and November. Over the summer, the equivalent figure was over eight per cent.
So like services inflation, wage growth is on a downward trend – but it remains too high to be sure that interest rates could be cut without risking a resurgence in inflation.
Unemployment
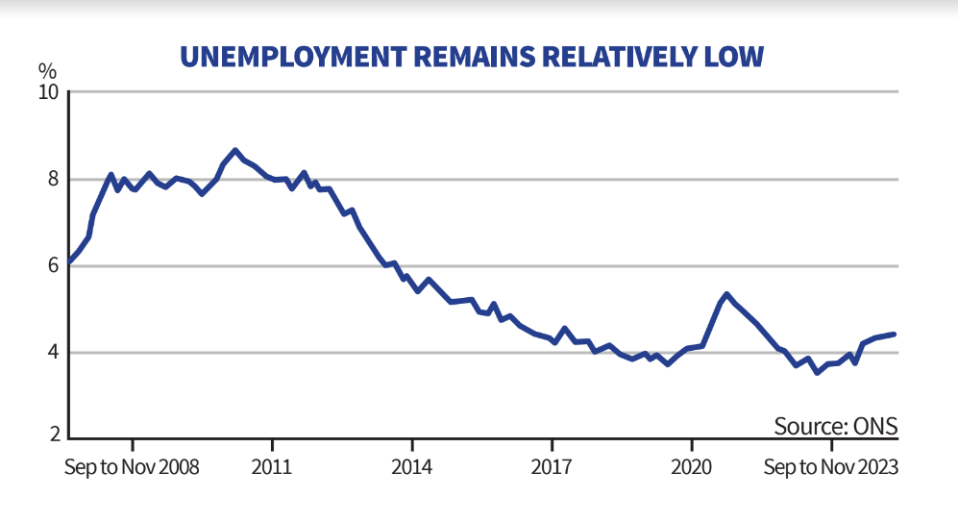
Policymakers have struggled to get a grasp of the UK’s unemployment rate as the Office for National Statistics (ONS) has stopped publishing its flagship Labour Force Survey.
This means that, to some extent, policymakers are flying blind. But we do know that unemployment has slowly picked up. It currently stands at 4.2 per cent, up from as low as 3.5 per cent in the aftermath of the pandemic.
The Bank has recently upgraded its estimate for the neutral level of unemployment – the level of unemployment at which inflation is stable or constant in the economy – to 4.5 per cent, which suggests there’s more work to do.
Vacancies
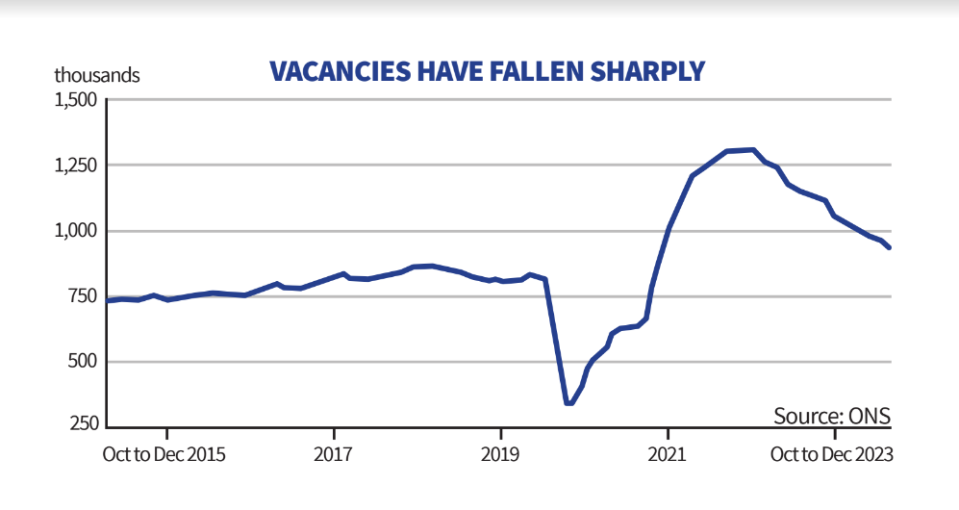
Although there is little concrete evidence on how the Bank’s interest rate hikes have impacted unemployment, other indicators show that the labour market is slowly loosening.
Having fallen for 18 consecutive quarters, vacancies, which measure demand for labour, are well down from the post-pandemic peak. Then there were more vacancies than workers.
However, there are still 133,000 more vacancies than immediately pre-Covid, pointing to the continued strength of the labour market despite the Bank’s rate hikes.
PMI
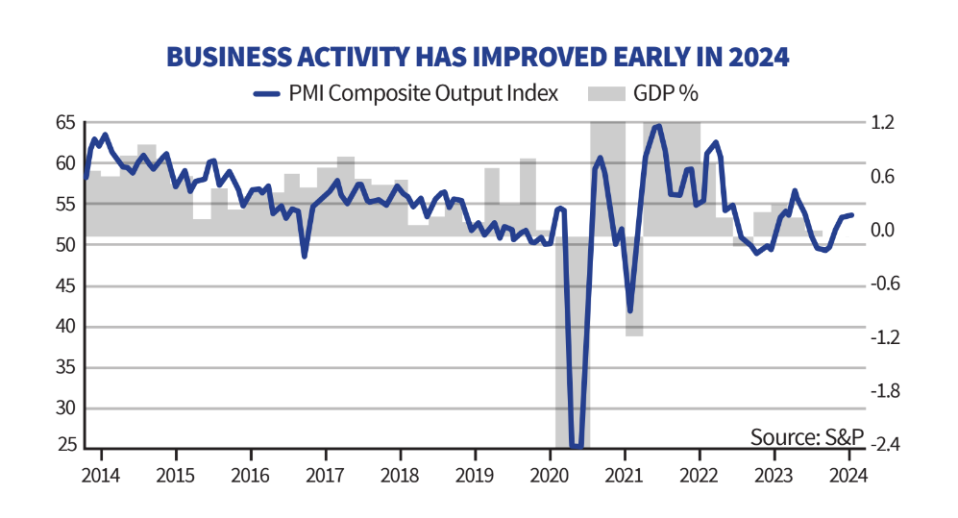
It is very likely that the UK economy slipped into a shallow recession at the end of last year, but early indicators for 2024 paint a rosier picture.
The latest purchasing managers’ index (PMI) for January surprised economists, rising further into positive territory. The eurozone, in contrast, remains stuck in contraction.
Firms in the service sector reported a “turnaround in demand” as consumers have some more certainty around interest rates. If growth picks up – and the Tories throw some tax cuts into the mix – then the Bank may have to keep rates on hold a little longer.