London house prices: Is the property supply crisis on the rebound? Here’s the top five spots for homes on the market with Wandsworth and Westminster top of the list

When it comes to London house prices, you have to throw out your notions of supply and demand: it’s all about location, location, location.
That’s no huge surprise of course, but what is surprising is the extent to which that’s the case.
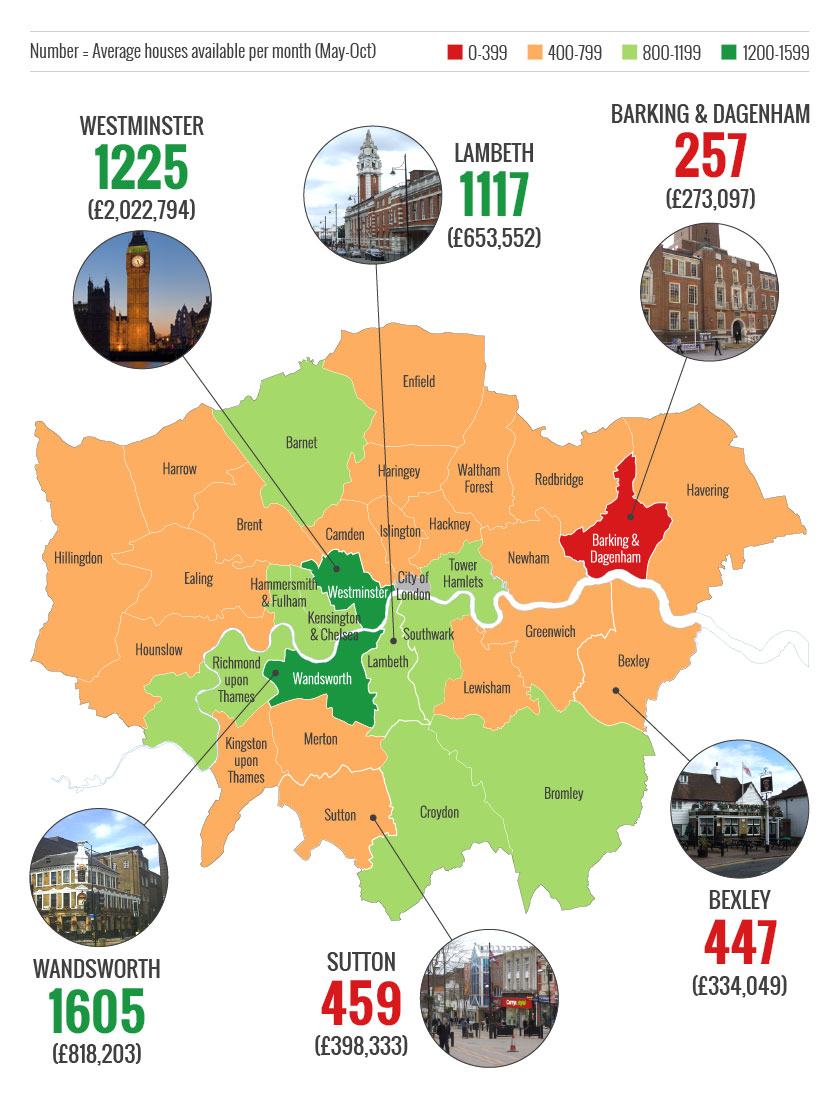
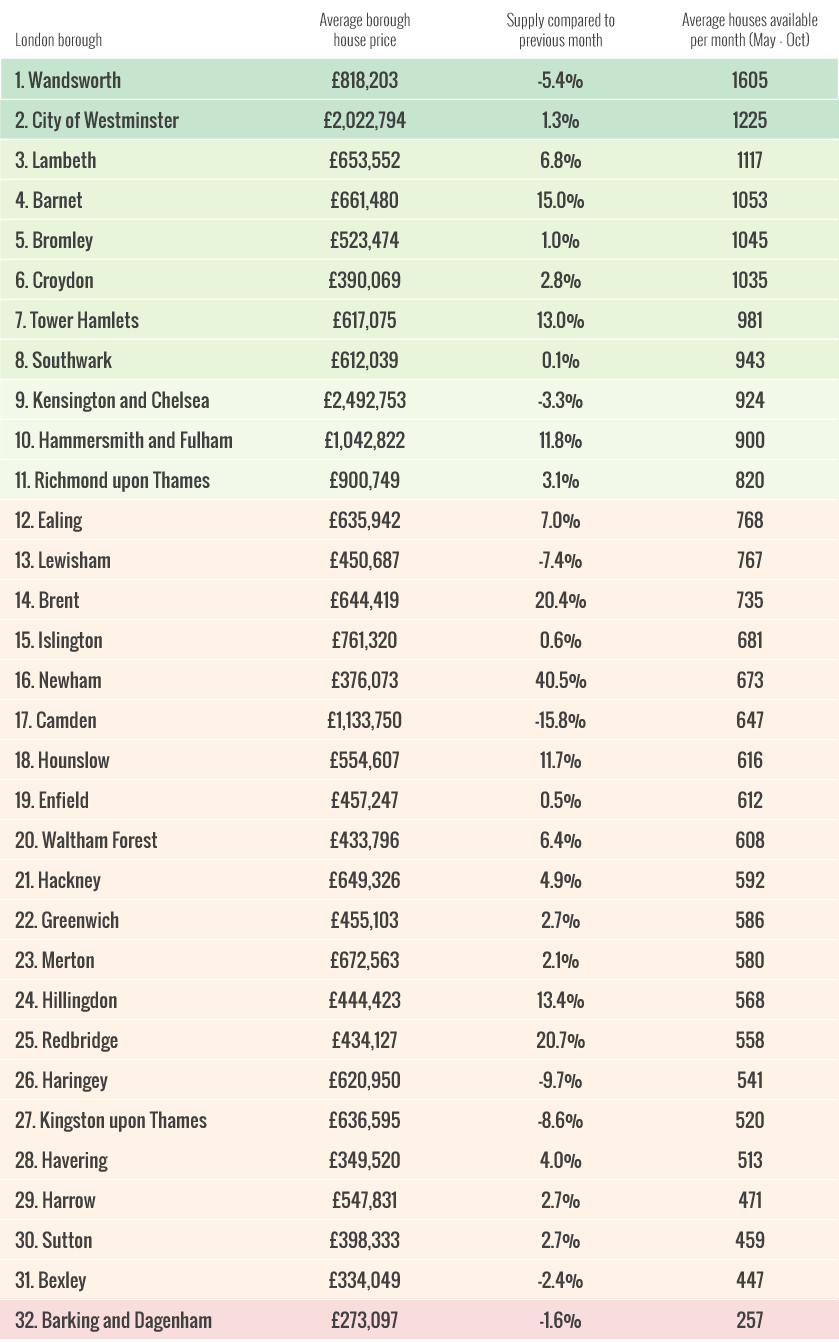
Wandsworth, the most expensive borough in the capital, actually had the largest number of houses go on sale each month this summer (May to October). Could this be the Nine Elms effect? Westminster was not far behind.
Meanwhile Barking and Dagenham, where the average price is the lowest at just over £273,000, had the smallest number of homes come onto the market.
Overall, London’s housing supply has increased by 3.8 per cent over the last six months, according to HouseSimple’s analysis of Rightmove.com’s data. This has perhaps been reflected in the cooling prices in parts of the capital.
Top five spots for average houses coming on the market shows a spread of the most and least expensive properties in London – Croydon’s average price is less than one fifth that of Westminster.
The map below breaks the stats down, while the interactive chart shows the monthly fluctuations in the number of properties coming onto the market.
We’ve also included a borough breakdown so you can see how your local area compares.

[custom id=”93″]
