Hunting for “10 baggers” – how the UK beat the US

The ups and downs of US technology stocks dominate headlines. Before this year’s tech correction it would have been hard to miss the news, for instance, that Apple’s market capitalisation had exceeded $3 trillion. That was not too far short of the entire value of the UK stock market.
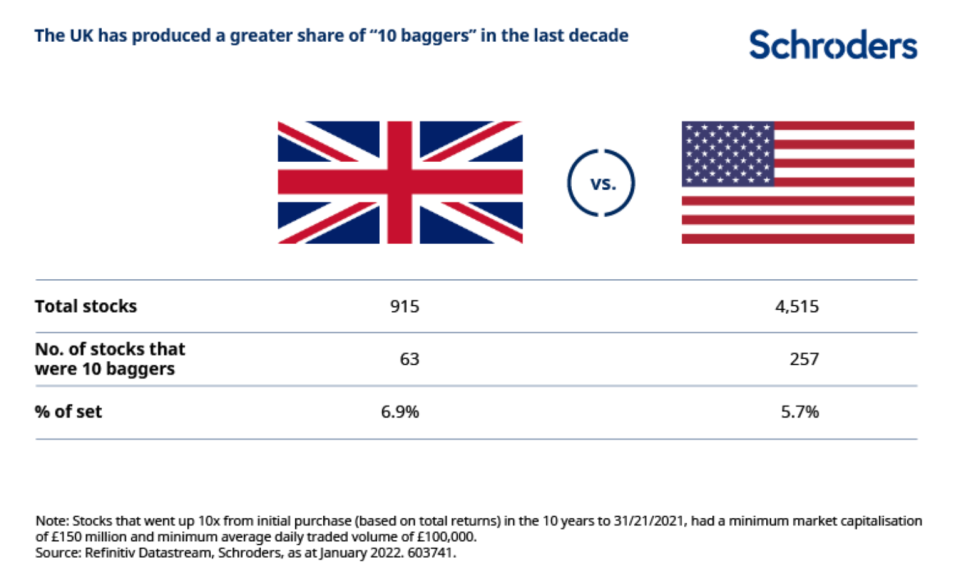
What is less well known, however, is that over the past decade you’d have had a better chance of picking a “10 bagger” in the UK than the US (see table below). Coined by highly successful American investor Peter Lynch the term describes a stock which has delivered 10-fold returns.

Past performance is not a guide to future performance and may not be repeated. The value of investments and the income from them may go down as well as up and investors may not get back the amount originally invested
We’ve found 63 UK companies to have achieved this over the past 10 years. Each generated a total return (share price gain plus dividends) in excess of 900%. This was based on having bought them at the price they ended 2011 (or for new companies their “issue” price) and held to 31 December 2021.
That’s equivalent to a 6.9% share of UK stocks versus 5.7% in the US. The companies include athleisure fashion retailer JD Sports, online grocer Ocado and research and data analytics business YouGov, whose shares are traded on the Alternative Investment Market (AIM) market.
The UK is often bemoaned as being an “old economy” stock market dominated by shrinking banking and oil sectors, rather than the more glamorous information technology (IT) companies, for example.
Discover more by visiting Schroders’ insights or click the links below:
– Read: Central banks diverge in the face of spiking inflation
– Listen: In search of the next generation of mega caps
– Watch: Why now’s not the time to be making big bets
The average UK 10 bagger, however, grew its top line at a compound annual growth rate of 12% in the past decade. Only one company saw revenues decline – Jet2, the package holiday provider, as a result of the coronavirus pandemic.
Sales growth was the second-largest driver of total returns – these are not companies whose shares have simply re-rated in line with investment fads.
And the 63 come from a variety of areas, with good representation from the industrials, consumer discretionary and financials sectors in addition to IT. Perhaps most importantly from the perspective of investors, they have grown profitably – expanding profit margins was the largest driver of returns.
These companies also tell us that dividends are not necessary for maximising returns (they were only a marginal component of total returns).
The lesson? Company managements with opportunities to invest at high rates of return should prioritise internal investment, or perhaps acquisitions, over dividends.
While there are many examples of ill-conceived acquisitions destroying value, just under half of our 63 made significant acquisitions in the decade. So, there are UK companies able to properly value targets and deliver those elusive synergies.
They include pest control business Rentokil, equipment hire group Ashtead, specialist engineer Halma, and JD Sports.
All four of these names, which have risen to become constituents of the FTSE 100, have made excellent use of acquisitions, to help generate great returns for investors in the past decade.
Any reference to sectors/countries/stocks/securities are for illustrative purposes only and not a recommendation to buy or sell any financial instrument/securities or adopt any investment strategy.
Topics:
Important Information: This communication is marketing material. The views and opinions contained herein are those of the author(s) on this page, and may not necessarily represent views expressed or reflected in other Schroders communications, strategies or funds. This material is intended to be for information purposes only and is not intended as promotional material in any respect. The material is not intended as an offer or solicitation for the purchase or sale of any financial instrument. It is not intended to provide and should not be relied on for accounting, legal or tax advice, or investment recommendations. Reliance should not be placed on the views and information in this document when taking individual investment and/or strategic decisions. Past performance is not a reliable indicator of future results. The value of an investment can go down as well as up and is not guaranteed. All investments involve risks including the risk of possible loss of principal. Information herein is believed to be reliable but Schroders does not warrant its completeness or accuracy. Some information quoted was obtained from external sources we consider to be reliable. No responsibility can be accepted for errors of fact obtained from third parties, and this data may change with market conditions. This does not exclude any duty or liability that Schroders has to its customers under any regulatory system. Regions/ sectors shown for illustrative purposes only and should not be viewed as a recommendation to buy/sell. The opinions in this material include some forecasted views. We believe we are basing our expectations and beliefs on reasonable assumptions within the bounds of what we currently know. However, there is no guarantee than any forecasts or opinions will be realised. These views and opinions may change. To the extent that you are in North America, this content is issued by Schroder Investment Management North America Inc., an indirect wholly owned subsidiary of Schroders plc and SEC registered adviser providing asset management products and services to clients in the US and Canada. For all other users, this content is issued by Schroder Investment Management Limited, 1 London Wall Place, London EC2Y 5AU. Registered No. 1893220 England. Authorised and regulated by the Financial Conduct Authority.