How the 2020 global share slump and recovery ranks in history

Stocks saw a record crash followed by a record rebound in 2020, creating some disparity between markets, as Duncan Lamont explains.
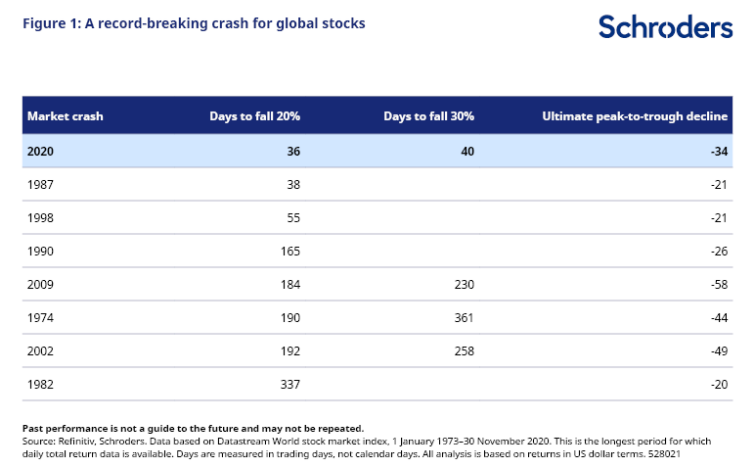
The global stock market crashed at a record speed in early 2020 (Figure 1).
On its way to a total decline of 34%, it clocked up a 30% loss in just 40 trading days.
This is faster than any global stock market crash in at least the last 48 years that we have daily data on global stock market returns for.

A record breaking rebound
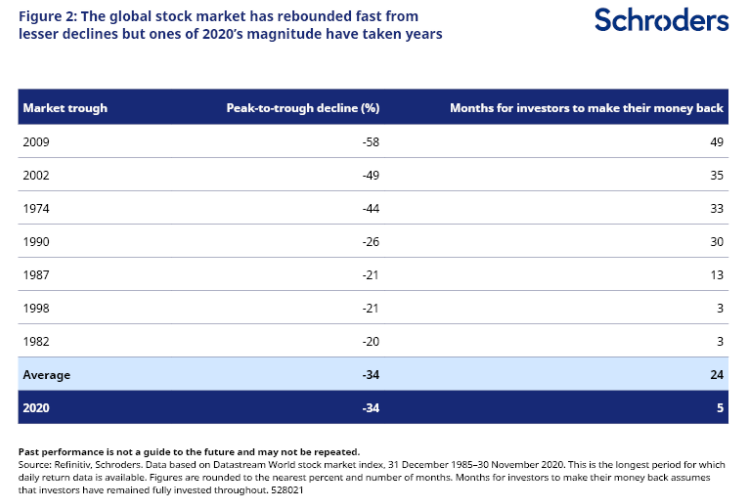
Astonishingly, in the eight months since, it has rebounded by 62%. The losses from this record-breaking crash were fully recovered by 23 August, only five months after the market bottomed and while the global economy was still deep in a quagmire. Since then it has sailed even higher, most recently on the back of positive vaccine news. The global stock market is now almost 8% above its pre-crash peak.
The crash was unusually severe in a historical context, and this recovery has been equally, if not more, extraordinary (Figure 2). Falls of this magnitude normally take years to recover from. On the previous three occasions when the market has fallen by more than 30%, it has taken nearly three years or longer for losses to be recovered. On average, a decline of 20% of more has taken two years to recover. Five months is unheard of.
The closest precedents are 1982 and 1998, when losses of around 20% were made up in only three months. However, to recover from a 20% decline, the market has to rise by 25%. To recover from a 34% decline, it has to rise by 52%. 1982 and 1998’s achievements pale into insignificance when compared in this way.
Discover more from Schroders:
– Learn: Can asset management’s Covid-19 response help regain public trust?
– Read: Is the vaccine the shot in the arm the market needs?
– Watch: How climate change could affect your investment returns?

Why has it been so strong?
History may be less useful than normal in working out what should have been expected of equity markets in 2020. We have to remember that the strength of the response from central bankers and politicians this year has been unparalleled. Governments have underwritten loans to companies and paid furloughed workers’ wages. Central banks have injected tremendous amounts of liquidity into the financial system. We have never before seen support on this scale.
Equity markets are looking through the current malaise to an anticipated rebound in activity next year and the one after. That is why equity markets have recovered so strongly.
But the recovery has been uneven
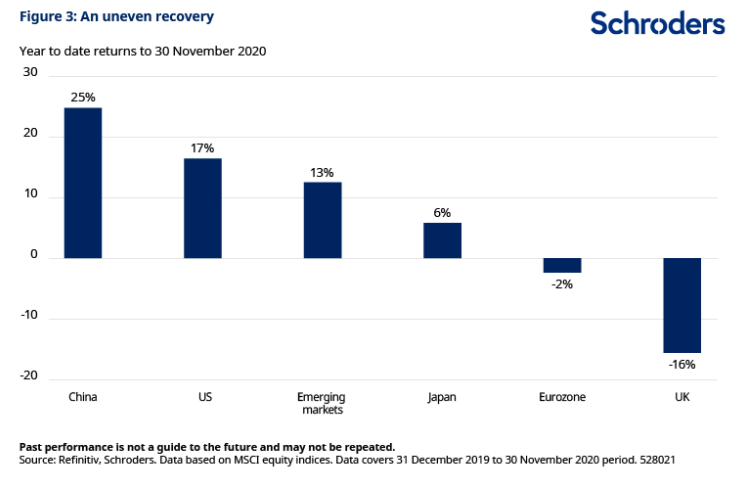
While the headline global figures paint a picture of buoyant equity markets, there has been tremendous variation between regions (Figure 3). Chinese stocks are up 25% this year and are 20% higher than their level before the crash in the first quarter. Emerging market equities in general have performed very strongly.
Within developed markets, the US has shone brightly, while Japan has also more than made up all of the losses it incurred. Eurozone equities have fared worse but are closing in on their breakeven point for the year.
It is the UK which really stands out as a laggard. It is still deeply underwater compared with its pre-crash peak. Investors are nursing losses of 16% this year. That’s quite the spread compared with the +17% the US market has delivered.
Why? Well, Brexit cannot be ignored, as that risk continues to influence international investors’ perceptions of the UK market. The UK also entered the year with a relatively large allocation to commodity sectors, which have fared poorly. And it has lacked the tech superstars that have been powering the US market higher (US stocks would be down for the year were it not for the big five of Facebook, Amazon, Microsoft, Apple, and Google).
One positive side-effect of this underperformance is that UK stocks are now cheaply valued compared with global peers. At such depressed pricing, it doesn’t have to take much in the way of better news for the UK market to start making up some of that lost ground on global peers. As always, past performance, in this case poor past performance, might not be a very good indication of future performance.

This information is not an offer, solicitation or recommendation to buy or sell any financial instrument or to adopt any investment strategy. Any references to securities, sectors, regions and/or countries are for illustrative purposes only.
The value of investments and the income from them may go down as well as up and investors may not get back the amounts originally invested. Past performance is not a guide to future performance and may not be repeated.
- For more on what lies ahead for the investors in 2020, please see our article Outlook 2021.
Important Information: This communication is marketing material. The views and opinions contained herein are those of the author(s) on this page, and may not necessarily represent views expressed or reflected in other Schroders communications, strategies or funds. This material is intended to be for information purposes only and is not intended as promotional material in any respect. The material is not intended as an offer or solicitation for the purchase or sale of any financial instrument. It is not intended to provide and should not be relied on for accounting, legal or tax advice, or investment recommendations. Reliance should not be placed on the views and information in this document when taking individual investment and/or strategic decisions. Past performance is not a reliable indicator of future results. The value of an investment can go down as well as up and is not guaranteed. All investments involve risks including the risk of possible loss of principal. Information herein is believed to be reliable but Schroders does not warrant its completeness or accuracy. Some information quoted was obtained from external sources we consider to be reliable. No responsibility can be accepted for errors of fact obtained from third parties, and this data may change with market conditions. This does not exclude any duty or liability that Schroders has to its customers under any regulatory system. Regions/ sectors shown for illustrative purposes only and should not be viewed as a recommendation to buy/sell. The opinions in this material include some forecasted views. We believe we are basing our expectations and beliefs on reasonable assumptions within the bounds of what we currently know. However, there is no guarantee than any forecasts or opinions will be realised. These views and opinions may change. To the extent that you are in North America, this content is issued by Schroder Investment Management North America Inc., an indirect wholly owned subsidiary of Schroders plc and SEC registered adviser providing asset management products and services to clients in the US and Canada. For all other users, this content is issued by Schroder Investment Management Limited, 1 London Wall Place, London EC2Y 5AU. Registered No. 1893220 England. Authorised and regulated by the Financial Conduct Authority.