How do Manchester City’s central defenders stack up against one another?

When Manchester City saw Vincent Kompany depart last summer they not only lost their captain and leader but also the club’s best central defender.
The problem is that, despite the more than £1bn invested in the squad by the current ownership, they did not replace him.
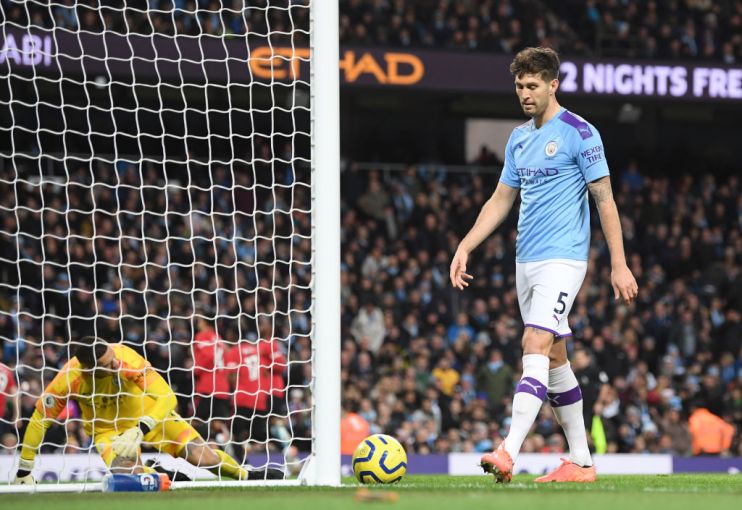
That decision has already come back to bite them as Aymeric Laporte, their most trusty centre-back, continues to suffer an injury-ridden campaign, while John Stones and Nicolas Otamendi only fleetingly reach the levels required at a club of City’s stature.
There is little doubt that Laporte’s injury has had a huge bearing on their ability to compete with Liverpool for the Premier League title and City come into Sunday’s Manchester derby with little to play for, given they sit second, 22 points behind the leaders but with seven points and a game in hand on Leicester.
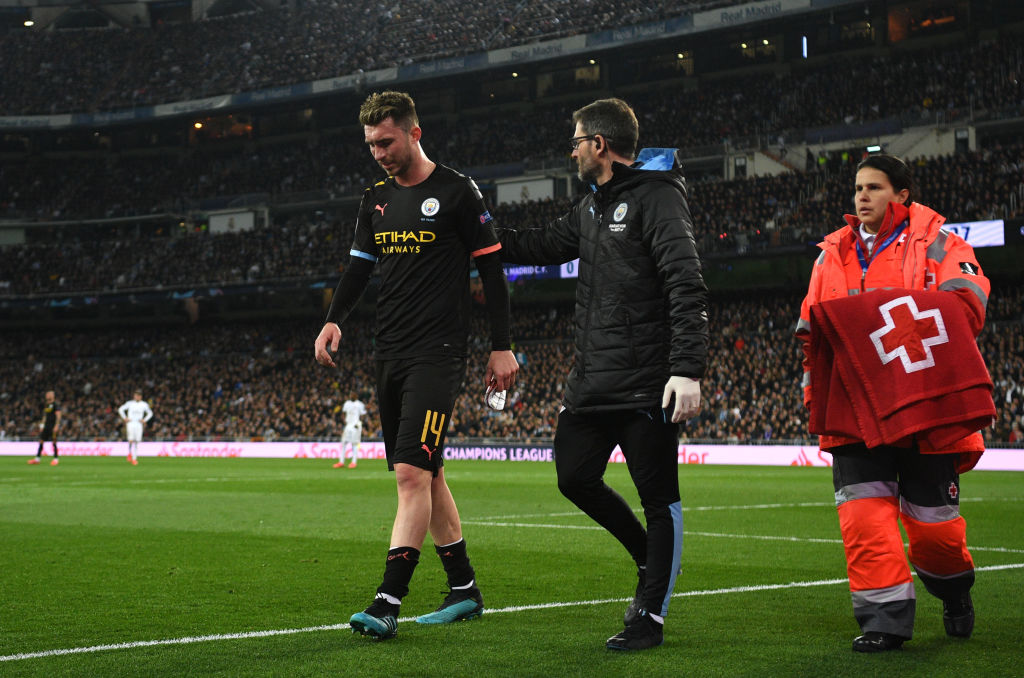
The 25-year-old has played just eight times this season and his continued absence, having being ruled out for a further month with a hamstring injury suffered against Real Madrid nine days ago, now threatens to derail the rest of their campaign too.
He will be unavailable for the weekend trip to Manchester United, a rescheduled league match with Arsenal next Wednesday, the FA Cup quarter-final against Newcastle and the Champions League second-leg with Madrid, a pivotal moment in their season.
Struggling Stones
Stones was signed with the intention of becoming the club’s leading centre-back, thanks in large part to his ball-playing ability, but it is his defensive unreliability that continues to be his downfall.
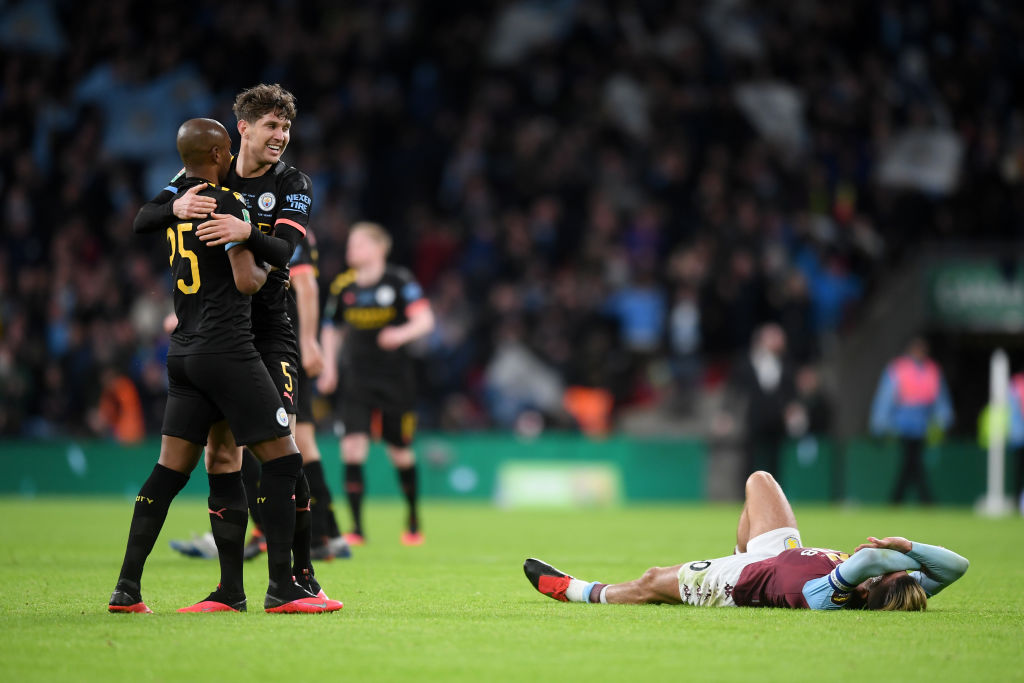
City were 2-0 up and cruising in last weekend’s Carabao Cup final when an error from Stones afforded Villa the opportunity to get back into the match; Mbwana Samatta obliged.

In the end the holders had to hang on for a 2-1 victory at Wembley as Villa pressed for an equaliser with increasing urgency.
It’s hard not to feel as though they would not have been in that position should Laporte have been playing.
Laporte’s importance
The Frenchman has been integral to City’s recent success, helping them to win the Premier League and Carabao Cup in 2018 before last year’s domestic swoop.
They are undefeated when he has played this season, winning seven of the eight matches he has started, while City have won 44 of the 51 Premier League games he has played in since joining, losing just four.

In Stones’s defence, his City career has been plagued by injury. The former Everton defender’s longest stint in the team this campaign has lasted just eight games.
But the statistics paint a clearer picture of just how preferable it is for Pep Guardiola to field Laporte as opposed to any of his other options – and especially Stones.
Just looking at this season’s Premier League campaign, City have conceded 0.43 goals per game when Laporte plays, versus three times more when Stones plays, at 1.36 per game.
Otamendi best of the rest
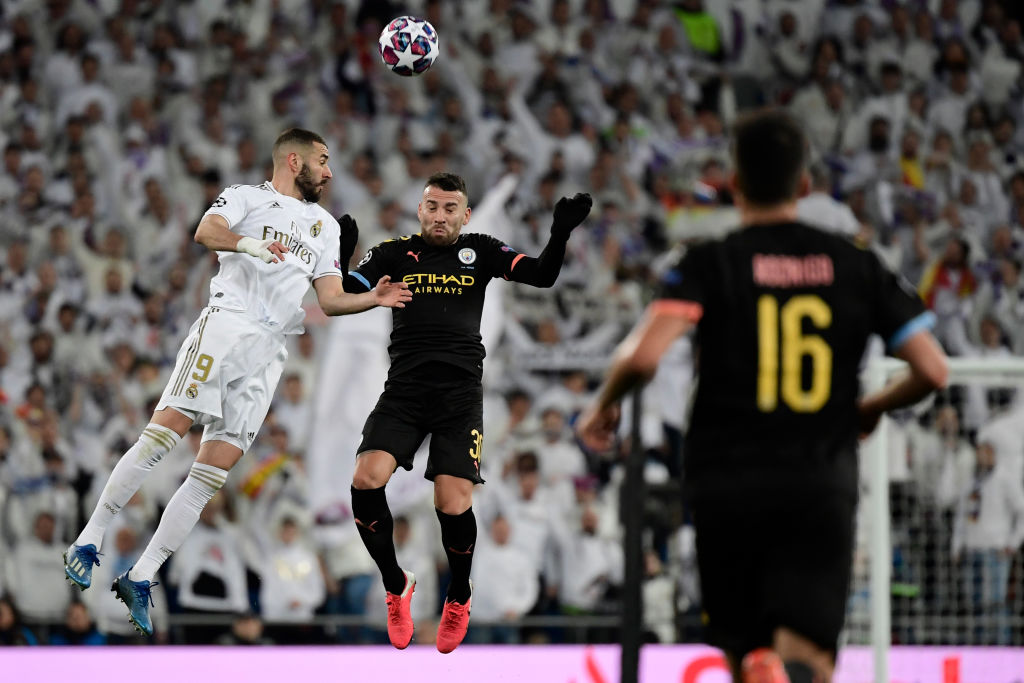
Nicolas Otamendi and Fernandinho, who have both played more matches, settle in between with 0.81 and 0.95 conceded respectively, but it is no coincidence that City have kept four clean sheets in the last four league games Laporte has started.
True to his ball-playing prowess, Stones has the best pass success rate, although Fernandinho makes the most passes overall.

But while the Englishman’s tackle count is in line with his peers, his 0.7 interceptions per match is some way off Laporte’s 1.9 and Fernandinho’s 2.0, and is perhaps symptomatic of inferior reading of the game and positional awareness.
With Laporte ruled out until the end of the month and fixtures coming thick and fast, Guardiola will likely rotate his three fit centre-backs.
However, it would not be surprising to see him select the unconventional duo of Otamendi, who he was willing to sell last summer, and Fernandinho, who at 34 was supposed to have a reduced role this campaign, on the big occasions – starting with Sunday’s Manchester derby.
| Premier League record 19/20 | Laporte | Stones | Otamendi | Fernandinho |
| Goals conceded per game | 0.43 | 1.36 | 0.81 | 0.95 |
| Passes completed per game | 73.7 | 64.0 | 61.3 | 77 |
| Pass success percentage | 92.1 | 94.0 | 92.4 | 89.8 |
| Interceptions per game | 1.9 | 0.7 | 1.0 | 2.0 |
| Tackles per game | 1.0 | 1.2 | 1.2 | 1.3 |
| Win rate percentage | 86 | 55 | 83 | 68 |