Gold hits record high – but is it really too expensive?
Even as it reaches new highs, we don’t think it’s time to grow concerned about the price of gold, or gold equities. Here’s why.
The gold price has been rising steadily and on Monday (27 July) hit an all-time high of $1,944/oz, beating its previous record high of $1,922 from 2011.
Chart 1: The gold price since 1970 ($/oz)
Such heights have led some investors to rue missing out on gold’s recent moves, viewing it now as expensive or even in a bubble. After a year-to-date rise of more than 20%, following a similar rise in 2019, this is an understandable reaction.
But taking a long-term view, of years not weeks, we don’t think it’s the correct reaction. And gold equities in particular are signalling that this cycle has a lot further to run.
Discover more:
Read: Sustainability: six ways the corporate world will have to change
Learn: What has driven stock market returns and what could drive them in the future?
Watch: Why do markets rise when economies slump?
Here’s why.
Looking at history, it’s worth pointing out that gold bull markets tend to end in sharp moves upwards, virtually in a straight line.
In 2011 for example, gold surged around 15% in the month before the peak and only ever traded above $1,800 for 19 days.
The peak average annual price was actually in 2012 at $1,669, well below current levels. In 1981, gold prices moved 80% between December 1979 and January 1980, an even more aggressive parabolic move.
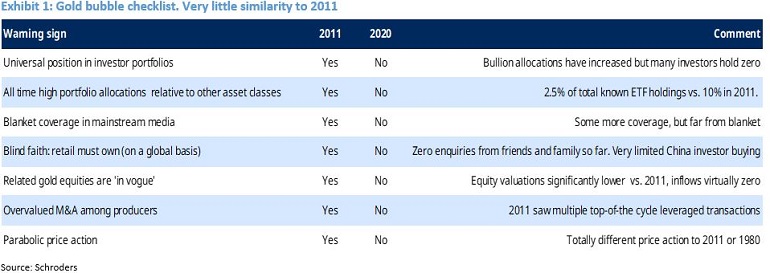
We came up with a checklist of warning signs to help us and other investors gauge whether gold is already in some kind of dangerous bubble phase. The result is that, we find very obvious differences between now and 2011.
If anything, we find ourselves asking are there any signs of a bubble in gold?
(M&A = mergers and acquisitions. Leveraged transactions are those funded by high levels of debt.)
One area where momentum has been clearly aggressive, is in the buying of physical gold by Exchange Traded Funds (ETFs). It has been the standout (in fact the only) area of demand growth in the 2020 gold market.
The numbers themselves are indeed very striking. According to published data, 643 tonnes have been added to physical gold ETFs so far this year, comparing to 372 tonnes added in all of 2019. In 2009 we saw a record annual increase of 665 tonnes.
For comparison, 656 tonnes equate to almost 40% of global gold production. Since the Federal Reserve effectively declared in April that it would do “whatever it takes” to keep the economy from collapsing, ETF holdings of gold have risen 72 out of 79 days.
Surely the scale of total ETF holdings (3200 metric tonnes in total or 104 million ounces) represents an unsustainable bubble?
Again, we really don’t think so. In an era of truly gargantuan global liquidity creation and highly elevated financial asset valuations, what really matters is how large these holdings are on a relative basis.
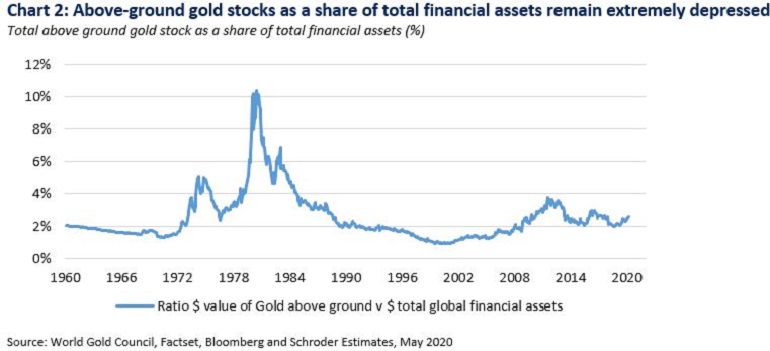
Looked at this way, gold holdings are not particularly high at all. In 2011, gold ETF holdings represented c.10% of all ETF holdings globally. Today that number is closer to 2.5%. Looked at on a more aggregate measure we estimate above-ground gold stocks represent just over 2.7% of total global financial assets, a vastly lower number than either 2011, 1980 or 1974.
Against a backdrop of record high global debt, we believe we are moving through a major epoch-change in global macro policy towards a much greater acceptance of inflationary outcomes.
The result is likely to be more deeply negative real interest rates and greater risk of broad currency debasement. In this environment continued increases in gold allocations could have extraordinary impacts on aggregate private gold holdings.
We don’t see why gold prices should be somehow capped at current levels at all in such an environment.
For gold producers, current operating conditions are exceptionally good and again stand in stark contrast to 2011 (a topic we will return to in a follow up article). On the revenue side, gold prices are being driven by understandably strong demand for gold as a monetary hedge. Meanwhile, operating costs remain broadly under control and management attitudes to large scale capital spending remain conservative. This is leading to both record operating margins and record forecast free cash flow generation, which is likely in turn to trigger material increases in distributions to shareholders.
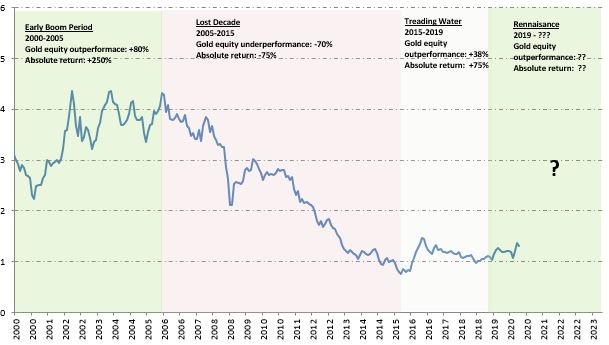
Despite this, gold equities have barely begun to outperform the price of bullion itself, another sign this cycle has much further to run (see chart 3 below).
Chart 3: Gold producer equities have barely begun to outperform the underlying gold price
FTSE Gold miners index divided by gold price (shown as a ratio)

Past performance is not a guide to future performance and may not be repeated.
Important Information: The views and opinions contained herein are of those named in the article and may not necessarily represent views expressed or reflected in other Schroders communications, strategies or funds. The sectors and securities shown above are for illustrative purposes only and are not to be considered a recommendation to buy or sell. This communication is marketing material.
This material is intended to be for information purposes only and is not intended as promotional material in any respect. The material is not intended as an offer or solicitation for the purchase or sale of any financial instrument. The material is not intended to provide and should not be relied on for accounting, legal or tax advice, or investment recommendations. Reliance should not be placed on the views and information in this document when taking individual investment and/or strategic decisions. Past performance is not a guide to future performance and may not be repeated. The value of investments and the income from them may go down as well as up and investors may not get back the amounts originally invested. All investments involve risks including the risk of possible loss of principal. Information herein is believed to be reliable but Schroders does not warrant its completeness or accuracy. Reliance should not be placed on the views and information in this document when taking individual investment and/or strategic decisions. The opinions in this document include some forecasted views. We believe we are basing our expectations and beliefs on reasonable assumptions within the bounds of what we currently know. However, there is no guarantee than any forecasts or opinions will be realised. These views and opinions may change. Issued by Schroder Investment Management Limited, 1 London Wall Place, London, EC2Y 5AU. Registration No. 1893220 England. Authorised and regulated by the Financial Conduct Authority.


