Four charts that show the impact the First and Second World Wars had on the UK’s population

After the phenomenal poppy display at the Tower of London, the loss of life during the First World War has taken on greater meaning for those remembering the conflict today.
Filling the moat around the Tower, each poppy symbolises one of 888, 245 Brits who died during the four years. But those clever types at the Office for National Statistics have put together data giving us another way of thinking about the scale of the war's impact – what it meant for our population in the immediate aftermath and for generations afterwards.
Here are four charts that show the effect of both First and Second World Wars on the UK's population.
The data, which is drawn from the country's census, starts by showing our population structure before the war.
In 1911, without the distorting effect of the war, you can see there were way more babies and children, dropping off at a fairly steady pace with relatively few people making it to their centenary.
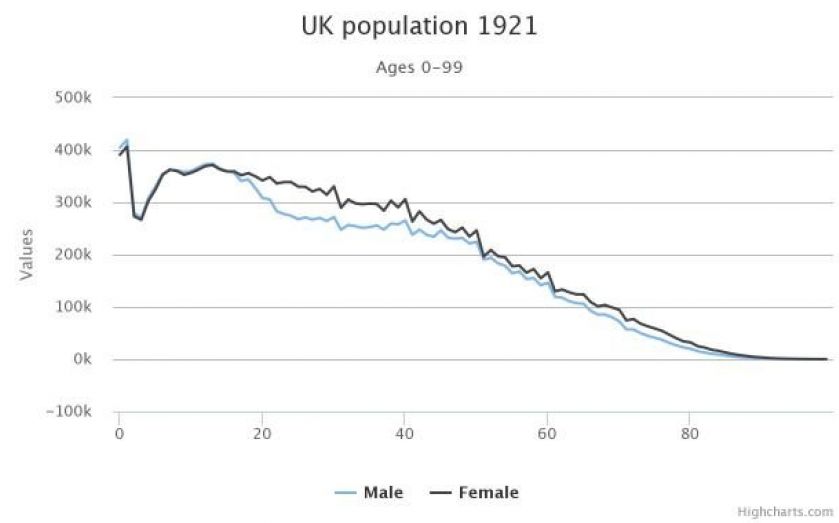
Fast-forward 10 years to 1921, and the initial impact of WWI can be seen.
Firstly, there is a significant drop in the number of men aged between 20 and 40, compared with women, underscoring the huge number of British servicemen who lost their lives between 1914 and 1918.
The second thing to note is the impact it is having on the next generation – a drop, followed by a spike, showing the rise in the number of post-war babies being born.
Thirty years later, the country was recovering from yet another war.
Where the structure of the population was previously a steady decline from cradle to grave, by 1951 there are spikes for two baby booms (the population aged three-to-four coming just after WWII, the population aged 30-31 coming just after WWI) and two wars (a huge dip in those aged 32-36, a smaller drop off in the number of 20-somethings).
Our most recent census was taken three years ago, and now we can see the impact WWI had largely slipping away.
By 2011, the babyboomers are now those aged 63-64 – still one of the largest population groups. Interestingly, though the ONS hasn't referenced it, there is another drop in numbers for those in their mid-30s, and a general decline in the numbers thereafter, which may well coincide with the proliferation of the contraceptive pill after it was legalised in 1961.