Four charts that sum up what’s happening with government borrowing

Since the Conservatives' election posters claimed to have halved the deficit, public sector borrowing figures have come under increasing scrutiny – and new figures out today paint a picture of government borrowing possibly being back on track.
The most recent numbers from the Office for National Statistics (ONS) include a few headline-grabbers: excluding public sector banks, public sector net borrowing (PSNB, otherwise known as the deficit) was down by £100m to £86.3bn for the April to December period: a small drop considering the government wants to be running a surplus by the end of the next parliament.

Debt was up compared to this time last year, reaching £1.48tn, or 80.9 per cent of GDP, a nominal increase of £94.6bn compared to December 2013.
The other detail that could cause old gripes to erupt back into the cycle is the inclusion in the figures of £2.9bn budget contribution to the European Commission. Although included in the expenditure for December, this £2.9bn won’t be added to the debt pile until the cash is paid sometime in 2105.
One of the reasons that the growing economy isn’t yet pushing back the deficit, despite growing GDP and a falling unemployment (5.8 per cent), is that salaries have only recently nosed ahead of inflation and many jobs are being created in low-paying sectors. That means lower tax receipts.

Wage growth accelerating (1.8 per cent not including bonuses) should help, but the timeframe for this remains unclear. Wage growth is only growing above inflation because the consumer price index is so low; at 0.5 per cent it is a long way behind the Bank of England’s target rate of two per cent.

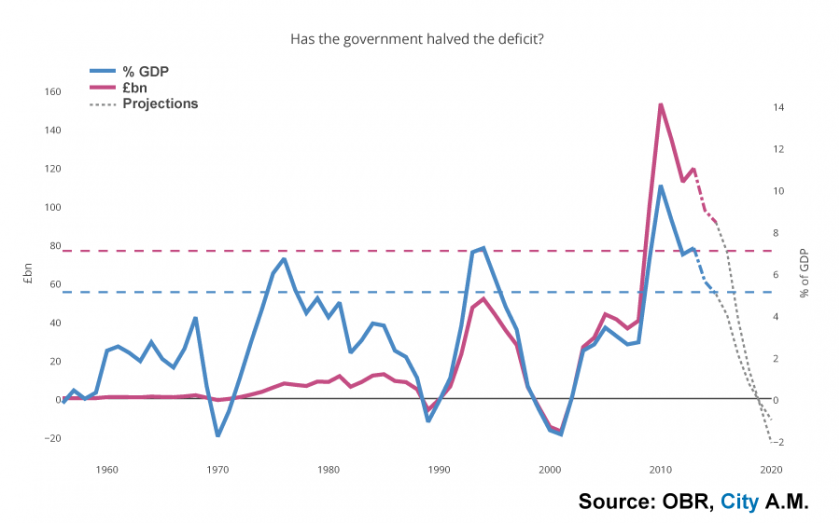
Is the deficit (the difference between receipts and expenditure) halved? That depends how you want to measure it – as an amount of money or as a percentage of GDP. In the latter case, preferred by many economists the answer is yes.
