Five charts which explain what is going on with inflation

“Output gap”, “bottlenecks”, “core inflation”, “base effects”, “second-round effects” “labour participation rate”. These are some of the key industry terms essential to understanding what’s going on with inflation.
Soaring job vacancies reflect the strong economic recovery of the world’s major economies, as Covid-19 induced restrictions have been gradually eased. Shortages of materials, energy and transport have also been seen, resulting in backlogs of work across a number of sectors.
“Demand is plenty strong enough,” said Keith Wade, Schroders’ chief economist. “The problem is that companies can’t get the goods out quickly enough. This is really about waiting for the supply side to improve.”
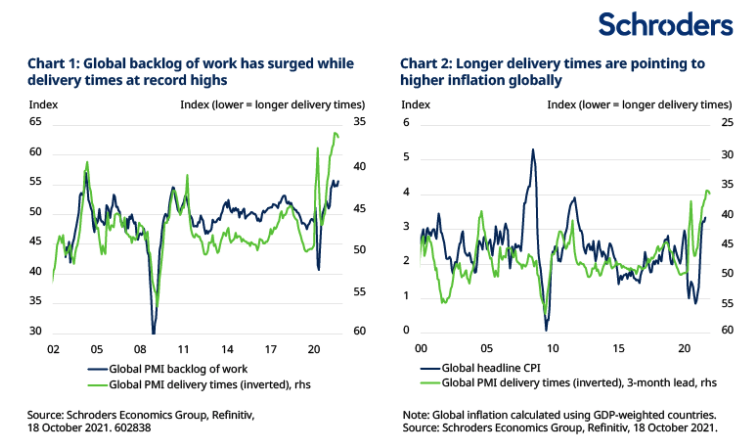
Backlogs are evident in surveys of business activity, or purchasing managers’ indices (PMIs), shown in chart 1. Supplier delivery times are tracked on the right-hand axis. A number below 50 indicates that it’s taking longer for deliveries to arrive at companies’ premises (time taken versus the previous month).

A deteriorating trend for supplier deliveries (think semiconductor microchip shortages) can impact the producers of goods and services and the costs they face. The producers may attempt to recoup their extra costs by raising prices for the consumers of the end product (laptops and new cars containing lots of microchips, for instance).
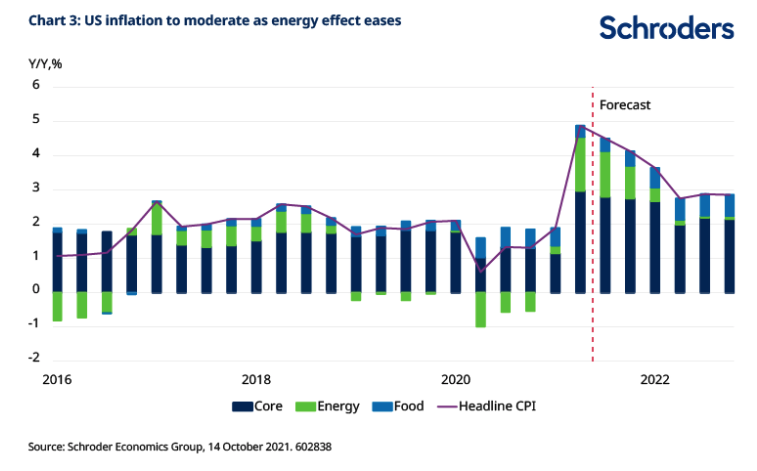
Such a trend is generally associated with higher consumer inflation, as widely tracked by consumer price indices (CPI) (see chart 2).
A zero-tolerance approach to the Delta variant of Covid-19, as has been seen in China recently, or ongoing restrictions in under-vaccinated emerging markets could extend the disruption. This might place further upward pressure on inflation.
The term “backlog”, however, implies a temporary situation. These are those so-called bottlenecks in supply chains, rather than permanent blockages and should, eventually, be worked through.
Possible remedies might include more staff at US ports working around the clock, or government subsidies to help energy-intensive industries in Europe manage particularly elevated natural gas prices.
Has the workforce shrunk since Covid?
It is, of course, possible that some of these bottlenecks turn out to be more permanent changes.
One question currently puzzling economists, for example, is whether the workforce has shrunk since the Covid-19 crisis. As of September, there were more than three million fewer workers participating in the US workforce than before the pandemic.
“If the labour force has actually shrunk in the US, there’s less spare capacity in terms of the output gap. The gap may be smaller than perhaps we realised and that might mean that core inflation proves to be more persistent,” said Wade.
An output gap is the difference between an economy’s actual output and its potential output. A “negative output gap” is usually a feature of economies closer to the beginning of a new economic cycle, before spare capacity is fully utilised.
Shortly after a recession of the kind sparked by the global financial crisis of 2007-2008, the output of goods and services in an economy might be expected to increase quite rapidly. Even if wages rise, increased production can reduce a company’s wage expense per item, or unit wage costs.
However, wages in Europe and the US are rising quite strongly in certain sectors and, more widely, soaring vacancies are causing some concern.
There are currently more than 10 million US job vacancies. This is more than the total number of people currently unemployed, a situation last seen in 2018, at the end of the previous economic cycle.
Discover more at Schroders insights and click the links below:
– Read: Can UK handle a rate rise as economy rebounds?
– Listen: The “stag” party no one wants an invite to
– Watch: How Covid-19 has affected the Inescapable Truths
Are today’s inflation rates artificially high?
Any analysis of inflation will draw a clear distinction between “headline” and core inflation. Headline inflation rates, which include the more volatile cost of living components (food and energy), are attracting plenty of headlines in the media.
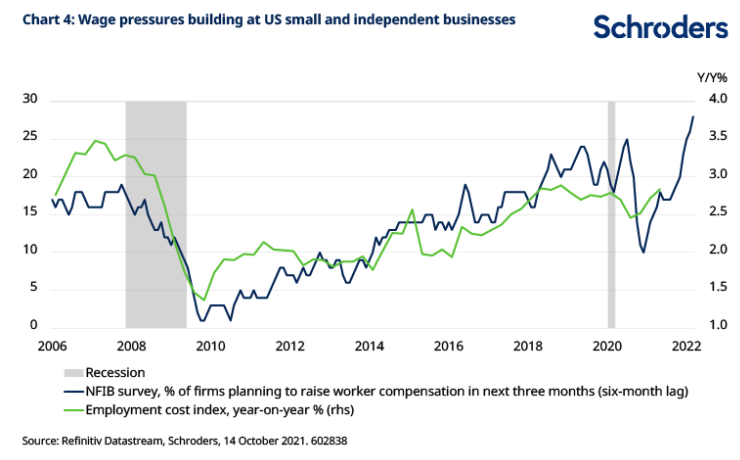
Very weak energy prices during the pandemic have created a low base for year-on-year comparisons. This has resulted in artificially high rates of headline inflation due to so called “base effects” (see chart 3).

Core inflation – which strips out these components – is a better measure of underlying price trends. The potential for higher for longer global energy prices has led to parallels being drawn with the 1970s. At that time, oil prices were very volatile for an extended period and wages were rising in many Western economies.
As a result, a number of these major economies experienced “stagflation”, a combination of slowing growth and accelerating core inflation. This is often known as “supply side inflation”, which can occur when economies have less capacity than expected as a result of labour shortages or bottlenecks, for example.
Such a scenario is an outside, albeit increasing, possibility.
Without careful economic management there is a risk we see round after round of wage and price rises, the destabilising “wage price spirals” referred to by IMF chief economist Gita Gopinath in early October. Here, expectations of inflation become a self-fulfilling prophesy. Prices climb – or become “unanchored” – as a result.
As things stand today, a number of components of core inflation which picked up as the US economy reopened earlier in the year (used cars, airline tickets, clothing, for example) have been moderating, giving some cause for optimism.
Second inflationary wave sooner than expected?
Although this is restraining inflation overall, the concern is that rising wages drive up some of the other core components where the relaxation of lockdown restrictions had little impact. This could include the cost of accommodation, for example.
The result could be a second wave of core price increases, the so-called second-round effects occurring earlier than many forecasts suggest. At present core CPI in the US is anticipated to dip back towards 2% next year, before picking up again.

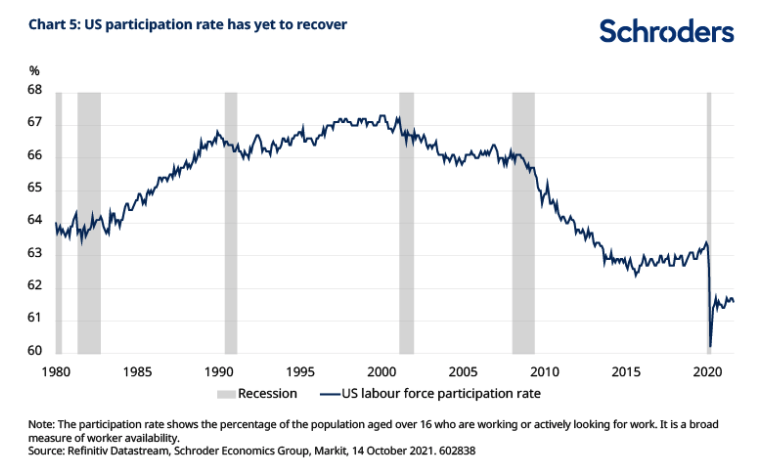
National Federation of Independent Business (NFIB) survey data shows almost 30% of small US firms are planning pay rises in the next three months, the highest proportion for more than 15 years.
The Bureau of Labor Statistics’ employment cost index, measuring employee compensation across the US economy, often tracks the NFIB survey. This is adding to concerns of higher wages coming down the line. (see chart 4).
“We are concerned about a second wave of inflation coming through as companies face higher wages and try to pass the cost of paying them onto consumers,” said Wade, explaining the current focus on the US labour participation rate (see chart 5).
The participation rate shows the percentage of the population aged over 16 who are working or actively looking for work. After falling quite sharply during the pandemic it has since recovered. But by September it was still around 1.5 percentage points below its pre-pandemic level, which is equivalent to a deficit of approximately 3.1 million workers.

“Wages are increasing as companies try to pull people back into the workforce,” said Wade. “Everyone has anecdotal evidence of how this is occurring, not just in the US, but across Europe and the UK wages are rising and in certain sectors quite strongly.”
For this reason there will be a lot of focus on the next set of US employment data covering October. Optimists hope that the return of schools and the end of enhanced benefits will spur people back into the jobs market, but fear of Covid and changing lifestyles may delay this.
After flatlining, economists are keen to see if the participation rate begins to inch back up again.
Those in charge of managing the smooth functioning of economies would welcome seeing some of the 3.1 million US workers return to the jobs market. Their participation might ease labour shortages and reduce the risk of a second wave of core inflation occurring sooner than expected.
– For more visit Schroders insights and follow Schroders on twitter.
Topics:
Important Information: This communication is marketing material. The views and opinions contained herein are those of the author(s) on this page, and may not necessarily represent views expressed or reflected in other Schroders communications, strategies or funds. This material is intended to be for information purposes only and is not intended as promotional material in any respect. The material is not intended as an offer or solicitation for the purchase or sale of any financial instrument. It is not intended to provide and should not be relied on for accounting, legal or tax advice, or investment recommendations. Reliance should not be placed on the views and information in this document when taking individual investment and/or strategic decisions. Past performance is not a reliable indicator of future results. The value of an investment can go down as well as up and is not guaranteed. All investments involve risks including the risk of possible loss of principal. Information herein is believed to be reliable but Schroders does not warrant its completeness or accuracy. Some information quoted was obtained from external sources we consider to be reliable. No responsibility can be accepted for errors of fact obtained from third parties, and this data may change with market conditions. This does not exclude any duty or liability that Schroders has to its customers under any regulatory system. Regions/ sectors shown for illustrative purposes only and should not be viewed as a recommendation to buy/sell. The opinions in this material include some forecasted views. We believe we are basing our expectations and beliefs on reasonable assumptions within the bounds of what we currently know. However, there is no guarantee than any forecasts or opinions will be realised. These views and opinions may change. To the extent that you are in North America, this content is issued by Schroder Investment Management North America Inc., an indirect wholly owned subsidiary of Schroders plc and SEC registered adviser providing asset management products and services to clients in the US and Canada. For all other users, this content is issued by Schroder Investment Management Limited, 1 London Wall Place, London EC2Y 5AU. Registered No. 1893220 England. Authorised and regulated by the Financial Conduct Authority.
