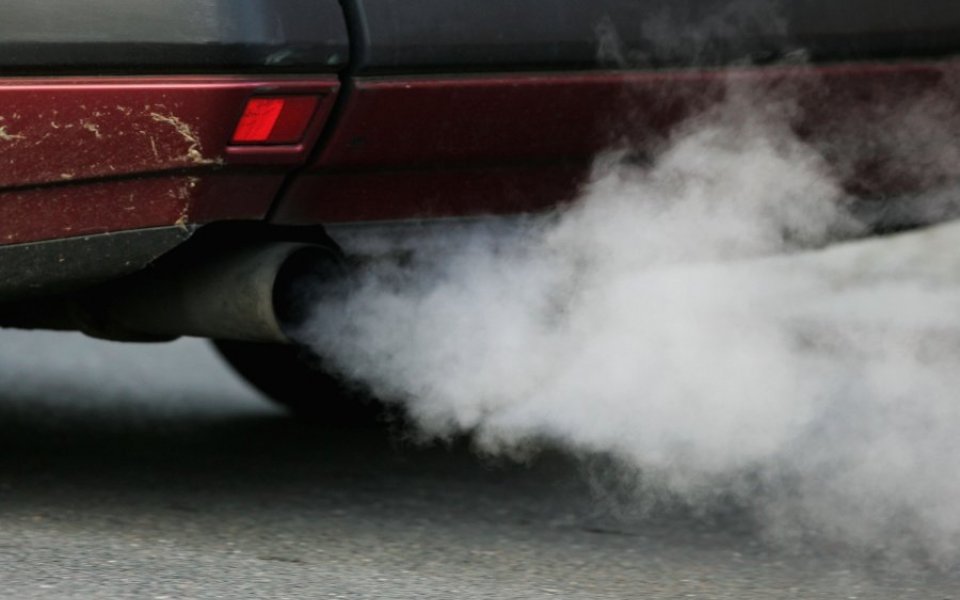
COP21 Paris climate change summit: UK emissions are dropping faster than the EU average – but what countries are emitting most carbon dioxide?

As the world waits for the outcome of the Paris talks, where world leaders are hoping to sign a new global climate deal within the next week, how much is each country actually emitting?
City A.M. has crunched the numbers to find what countries are emitting most – and, crucially, which have reduced their emissions most in recent years.
China continues to be world-leading (an unfortunate accolade if ever there was one) when it comes to total greenhouse gas emissions. Of course, all this really tells us is that the country a) has the world’s largest population, and b) is home to a rather startling proportion of global manufacturing. A more useful figure to look at for fair comparisons is emissions per capita.
Read more: Four things you need to know about climate change and the Paris talks
The chart below shows the most recent World Bank data, setting emissions per capita against how countries emissions are changing. You can change the scale on the bottom axis to explore the smaller countries, or choose to scale circles by GDP per capita or total emissions.
[custom id="107"]
The world emitted an average of 4.9 tonnes per capita in 2011, and despite international initiatives and efforts to reduce emissions, our global carbon footprint has risen four per cent worldwide since 2001.
Some have done better than others, of course. The EU has managed to bring emissions down by 13 per cent – and has pledged to slash them further in upcoming years, with a target of reducing emissions by 40 per cent from 1990 levels by 2030.
The UK's emissions are dropping faster than the EU average, down 23 per cent in the time period, but we're still beaten by neighbour Ireland, where emissions have been slashed by a full 31 per cent.
And no country can match Singapore, which has succeeded in cutting emissions per capita by 64 per cent between 2001 and 2011, sending them crashing down to 4.3 tonnes per head annually.
Emerging markets are seeing the biggest rise in emissions, as countries become wealthier. Data from the World Bank shows emissions in “upper-middle income countries”, defined as having a per capita gross national income between roughly $4,000-12,500, have soared 87 per cent in the past ten years.
Of course, with an average per capita emission of 5.7 tonnes per capita, they’re still light years behind the richest countries. Although they’ve managed to begin reducing their footprint, the world’s wealthy continue to be the world’s worst offenders, emitting an average of 11 tonnes per capita, or more than double the global average.