London’s rail dominance in one chart

Rail travel has been steadily rising in the last decade and journey numbers are approaching the 1920s heyday.
Overall UK journeys in the last three months of the year rose 3.9 per cent on last year to 390.3m, as Britons travelled a whopping 15.1bn kilometres on the railways. Passengers spent £2bn on tickets, up 6.4 per cent. All of these figures are the highest since the Office of Rail Regulation started compiling these stats in 2002.
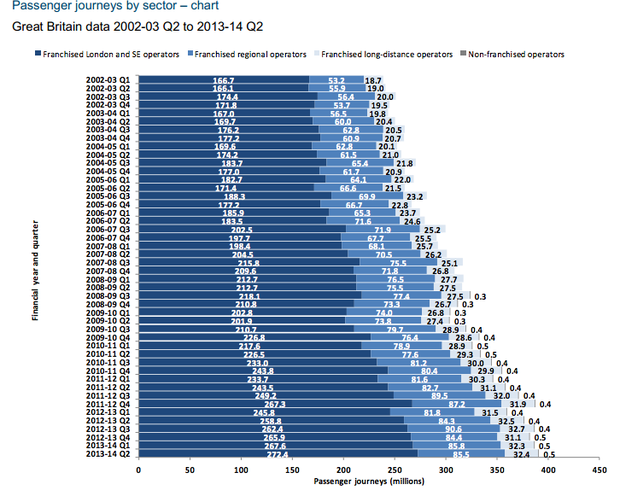
But this graph, published by the ORR today, shows just how dominant London and the South East are when it comes to the railways, with almost seven in ten of all rail trips made in the region.

Source: ORR
Meanwhile the number of new services is rising much more slowly, with timetabled train kilometres up 0.9 per cent on last year in the last three months of the year – though much of this increase is accounted for by the London Overground.
The ORR said: “There are a number of possible factors behind recent increases in rail usage such as the opening of new lines and stations, additional services/trains particularly on London Overground and Chiltern Railways. The increased demand for suburban travel to/from London and season tickets suggest that the driver behind this growth is work-related rather than leisure travel.”