In charts: Here’s what the government’s public sector borrowing figures actually mean

Figures published by the Office for National (ONS) Statistics today showed public sector borrowing has risen again – this time to £32.4bn between April and July, up from £23bn during the same period last year.
These figures are slightly skewed by the Bank of England's quantitative easing programme from last year – stripping that out, the true figure for this year "is £37.0bn, or £1.8bn higher than the same period in 2013/14".
The total figures for this June, at £200m, was £800m lower than the equivalent stat from June 2013. Monthly data is often too volatile to be useful and it's best to look at long-term trends.
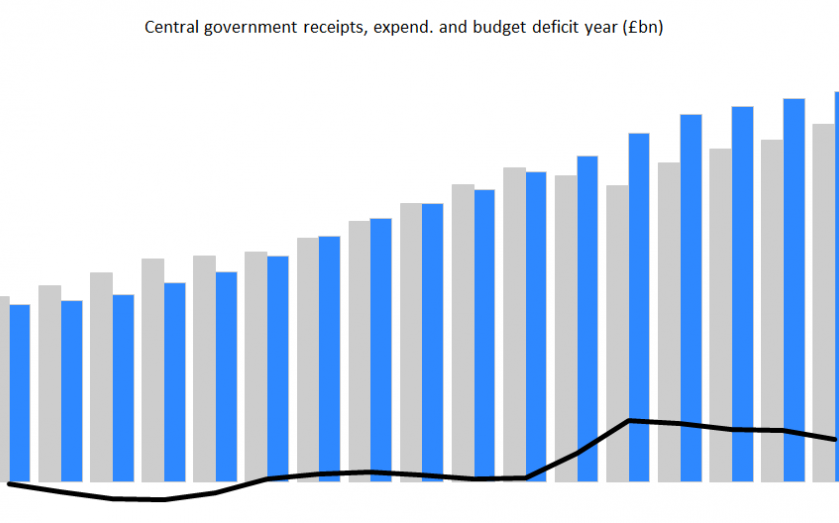
The big problem for the government is that the recovery isn't translating into high enough tax receipts, which means a slow reduction of the deficit, as this graph shows.

Receipts rose on last year, however.
Central government receipts (excluding APF) for the financial year-to-date were £187.4 billion. This was £3.8bn (2.1 per cent) higher than the same period in 2013/14.
… as is the combined total of production taxes.


