New London Underground map reveals how much you pay in average rent at every Tube stop on the Piccadilly, Victoria, District, Central, Northern, Bakerloo, Jubilee and Metropolitan line

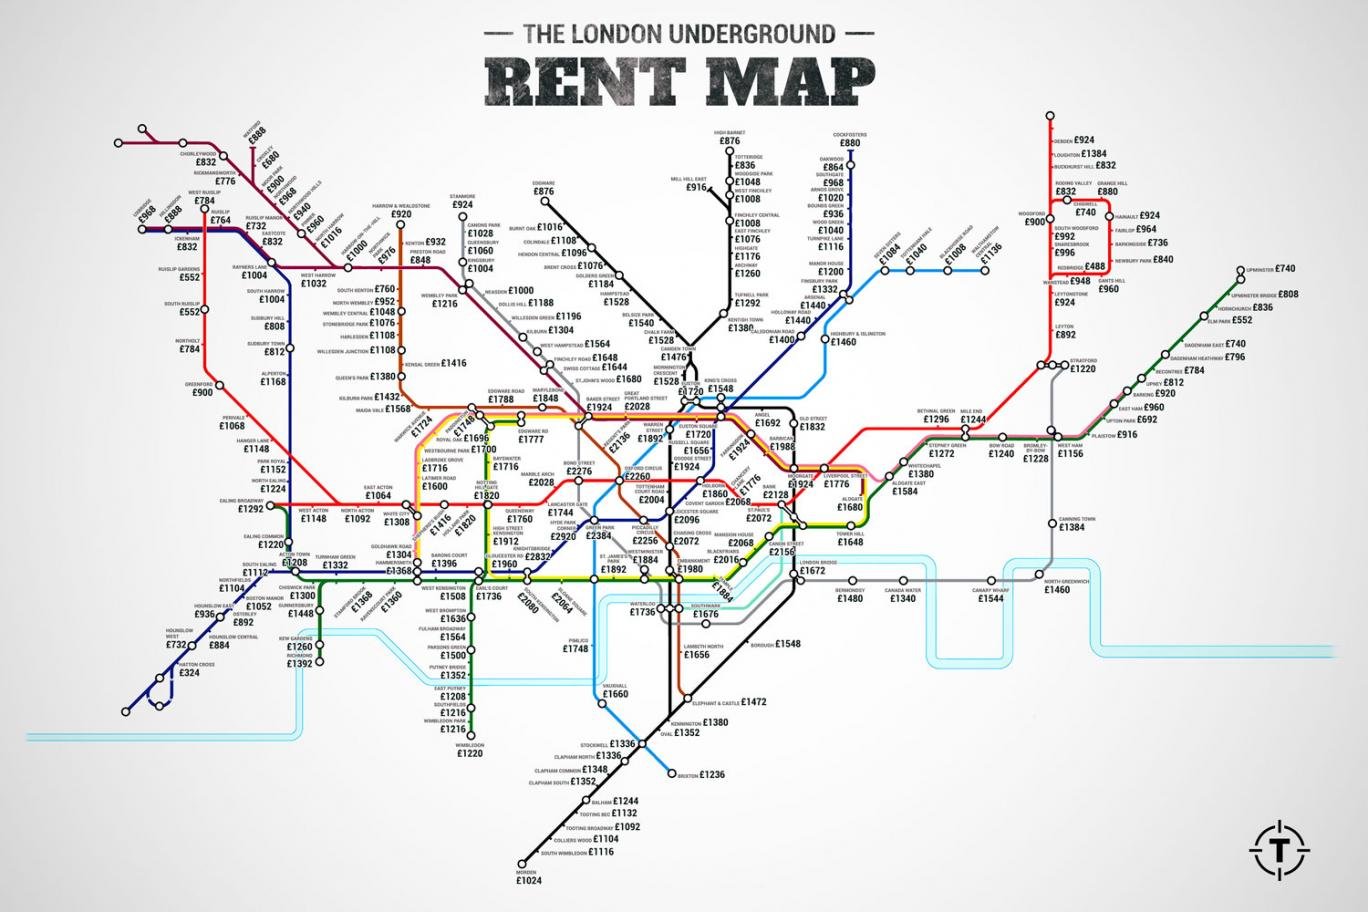
A new London Underground map reveals the average (staggering) rent at every Tube stop in London.
London’s exorbitant rents are obviously nothing new, but this map clearly lays bare the disparity between different parts of London.
A flat by London’s most expensive Tube station will set you back nine times more than the same size property in the cheapest part of the capital.
The map, put together by website Thrillist based on data from Find Properly, reveals the median monthly cost of renting a one-bedroom flat within one kilometre of the Tube station.

(Click on the map for a full-size version. Source: Thrillist)
By Hyde Park Corner, which comes top of the charts, a one-bedroom flat will set you back £2,920 every month.
Ouch.
The runner-up, Knightsbridge, isn’t far behind at £2,832, while nearby Green Park comes in third at £2,384.
| Most expensive Tube stops | Median rent |
| Hyde Park Corner | £2,920 |
| Knightsbridge | £2,832 |
| Green Park | £2,384 |
| Bond Street | £2,276 |
| Oxford Circus | £2,260 |
| Piccadilly Circus | £2,256 |
| Cannon Street | £2,156 |
| Regent's Park | £2,136 |
| Monument | £2,128 |
| Bank | £2,128 |
London’s cheapest housing, meanwhile, is found in Hatton Cross, where the average one-bed flat costs just £324 per month to rent.
| Cheapest Tube stops | Median rent |
| Hatton Cross | £324 |
| Redbridge | £488 |
| South Ruislip | £552 |
| Ruislip Gardens | £552 |
| Elm Park | £552 |