2021’s top traded stocks at IG and outlook for 2022
What were the most popular stocks in 2021? We look at how equity markets continued to rise with economic recovery and how investor sentiment on sectors has begun to change with increasing interest rates.

The most traded stocks in 2021
Last year was an overwhelmingly positive period for equity markets with many developed market stock indices reaching all-time highs as investors displayed confidence in the global economic recovery. Negative news seemed to mostly be shrugged off, the most pertinent being: historically high levels of inflation, new Covid-19 variants, and supply chain bottlenecks.
Whereas the success of vaccination programmes, booming labour markets as well as monetary and fiscal stimulus to support the economy appeared to win investors over. Overall, U.S. equities rose by a remarkable +30% in 2021, while U.K. and European stocks returned +18.4% and +14.7% respectively.
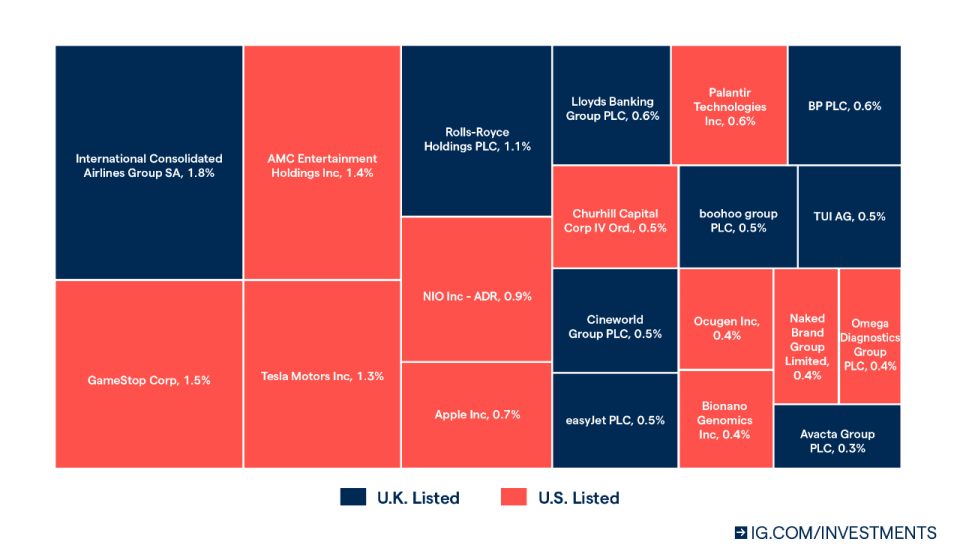
So, given the strong returns in the stock markets last year, what were the most popular equities amongst IG clients in 2021? The figure below maps the stocks that have been dealt the most last year, presented as a percentage of overall trades on share dealing, individual savings account (ISA) and self-invested personal pension (SIPP) accounts.
Figure 1: Top twenty most popular equities in 2021 by number of trades

Popularity of Electric Vehicle stocks
Electric vehicle companies had a significant presence in the top twenty most traded equities last year due to their high growth potential and environmental, social and governance (ESG)-friendly characteristics, with sustainable investing reaching records highs according to Bloomberg*. Tesla (TSLA) was, of course, the most popular stock within the industry, accounting for 1.4% of total trades from IG investors in 2021, but NIO Inc (NIO) was not too far behind at 0.9% of trades.
Furthermore, we saw a number of new listings within the electric vehicle space last year with the two most notable being Rivian Automotive (RIVN) and Lucid Group (LCID). Rivian was listed through a traditional IPO back in November 2021, raising an estimated $11.9 billion making it the largest listing last year and also the biggest IPO from a US firm since Facebook. On the other hand, Lucid elected to go public via a special purpose acquisition vehicle (SPAC) deal, under Churchill Capital Corp IV Ord which made up 0.5% of trades in 2021. Although, Lucid announced in December that it received a subpoena from the US Securities and Exchange Commission (SEC) to investigate its SPAC deal, shares of Lucid dropped as much as 19.5% after the news broke.
Recently, Tesla reported results in which they beat estimates on both earnings and revenue with earnings per share (EPS) coming in at $2.52 versus $2.36 expected amongst analysts. Although, Elon Musk put forward an updated product road map where he said Tesla will not release any new vehicle models in 2022, instead focusing on autonomous vehicle technology and scaling production. Musk also added that he was concerned supply chain issues could persist throughout the year. After the earnings announcement, Tesla’s share price dropped considerably, with the likes of NIO, Lucid Group and Rivian all being swept up in the rout with their share prices falling by between -6.8% to -12% on the day.
Rise of ‘Meme-stocks’
In January 2021 the market experienced a new phenomenon where retail traders banded together to attempt to drive up the price of a company’s shares, utilising social media platforms such as Reddit to do so. These stocks became to be known as ‘meme-stocks’, with two of the most prominent being GameStop (GME) and AMC Entertainment (AMC), both of whom have built up a cult-like following. The strategy behind driving share prices higher was to target heavily shorted stocks, such as AMC and GameStop, to cause what is known as a short squeeze.
As a result, these stocks experienced large spikes in volatility as well as surging trade volumes as fear of missing out overwhelmed investors. As seen in Figure 1 above, both GameStop and AMC were the second and third most popular stocks of all last year. The huge increase in trades we saw in the first quarter (Q1) of 2021 enabled both to maintain their top three ranking, even after interest faded as the year went on.
Airlines and Health care stocks
As expected, Covid-19 also created a large amount of interest in the Airline and health care industry.
The global aviation industry has been one of the hardest hit by the Covid-19 pandemic, as governments around the world restricted international travel to curb the spread of the virus. As seen in Figure 1, Airlines were one of the standout sectors in 2021, with IAG claiming the top spot for the year whilst the likes of EasyJet (EZG) and TUI (TUI) were also ranked in the top 20 stocks. The prolonged Covid-19 crisis also adversely impacted Rolls-Royce (RR), the fifth most popular stock last year, which generates revenue in its civil aerospace division by the number of hours its engines fly.
Trades on pharmaceutical stocks also saw a spike in demand, particularly in December when the high infectious Omicron variant became the dominant strain of Covid-19. Ocugen Inc (OCGN), Omega Diagnostics Group (ODX) and BioNano Genomics (BNGO) were the most popular amongst IG investors as all stood to stand potentially gain from the pandemic through developing rapid antigen testing or vaccinations against Covid-19. To illustrate the impact of Omicron further, Genedrive (GDR) saw trades rise an incredible +2,975% from November to December as a result of its Covid-19 test receiving EU approval.
US equities continued to dominate but could this change?
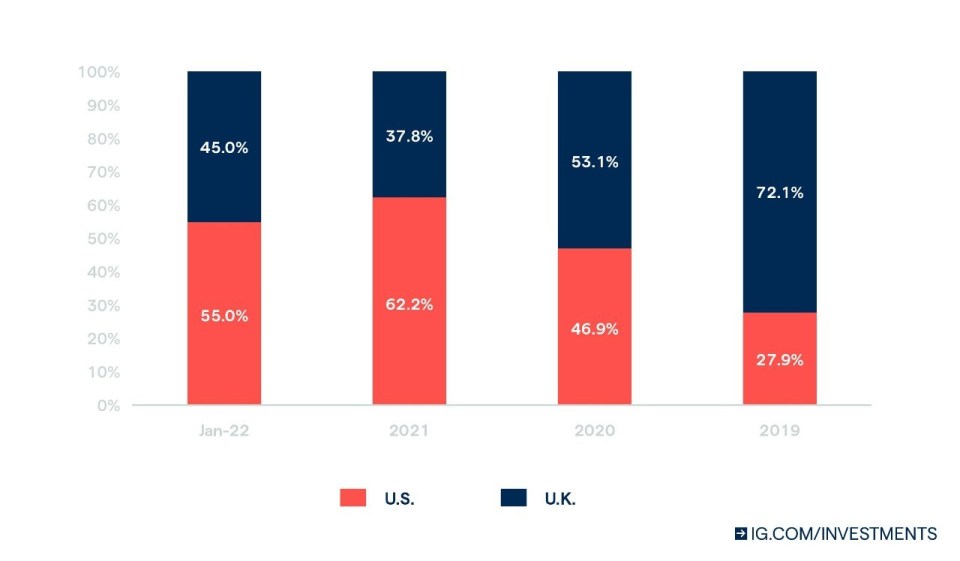
We also saw UK investors diversifying away from home-country stocks into US equities last year, to a point whereby the majority of trades are now on US shares, as seen in Figure 2 below.
One of the most significant reasons behind this trend is the relative outperformance of US assets compared to the UK in recent years; with the S&P 500 returning +11.6% more than the FTSE 100 last year alone. This overperformance is largely due to the S&P 500’s greater exposure to growth stocks, which tend to perform better in a low-interest rate environment. Technology and health care making up approximately 42% of the index.
In contrast, typical value sectors such as financials and consumer staples are the two largest in the FTSE 100 with a weight of around 37% in the index, whilst technology stocks make up a mere 1.1%. Other notable factors behind the increasing popularity of US stocks were the rise of meme-stocks and the heightened levels of US SPAC completions in 2021.
Figure 2: UK versus US stocks trade split

However, the prospect of multiple interest rate hikes by the US Federal Reserve in 2022 to combat high levels of inflation seems to have started to pivot the investment decisions made by IG clients. As seen in Figure 2 above, there is early evidence from January trade data that interest in UK equities is starting to pick.
Stronger recent returns from the UK equity market relative to the S&P 500 so far this year may be the driving force behind this swing with the FTSE 100 outperforming the S&P 500 by +6.0% in January, in GBP terms. As previously mentioned, the FTSE’s larger exposure to typical value stocks such as financials and energy has resulted in this recent overperformance. Perhaps this is a sign of what we may see throughout 2022.
Trades by sector also suggests investors have started to tilt away from riskier assets in 2022
A similar narrative can be seen when looking at the January 2022 versus Q4 2021 trade concentration by sector for IG investors. In Q4 2021 we saw a considerable quarter-on-quarter rise in client interest from the traditional growth sectors with consumer discretionary (+2.4%), technology (+1.6%) and health care (+0.7%) stocks all growing in terms of trade concentration by sector at the expense of value stocks.
However, in January, IG investors began to shift their trades away from riskier assets, such as health care stocks which made up -4.9% less of the overall trade breakdown, into value sectors. As seen in Figure 3, financials, utilities and consumer staples increased their share of trades by between +0.6% to +1.1% whilst energy stocks were the biggest movers at +1.6%. Although, trades on technology shares did increase, in terms of trade concentration, but this could be explained due to the number of major technology firms that reported earnings last month.
Figure 3: Trade concentration by sector
| Sector | January 2022 | Q4 2021 | Difference |
| Energy | 8.1% | 6.5% | 1.6% |
| Financials | 8.8% | 7.7% | 1.1% |
| Communication Services | 8.7% | 7.9% | 0.7% |
| Utilities | 1.4% | 0.7% | 0.7% |
| Consumer Staples | 3.3% | 2.7% | 0.6% |
| Technology | 18.7% | 18.3% | 0.4% |
| Materials | 8.3% | 7.9% | 0.4% |
| Real Estate | 1.2% | 1.2% | 0.0% |
| Consumer Discretionary | 18.9% | 19.0% | -0.1% |
| Industrials | 11.5% | 12.0% | -0.5% |
| Health Care | 11.1% | 16.1% | -4.9% |