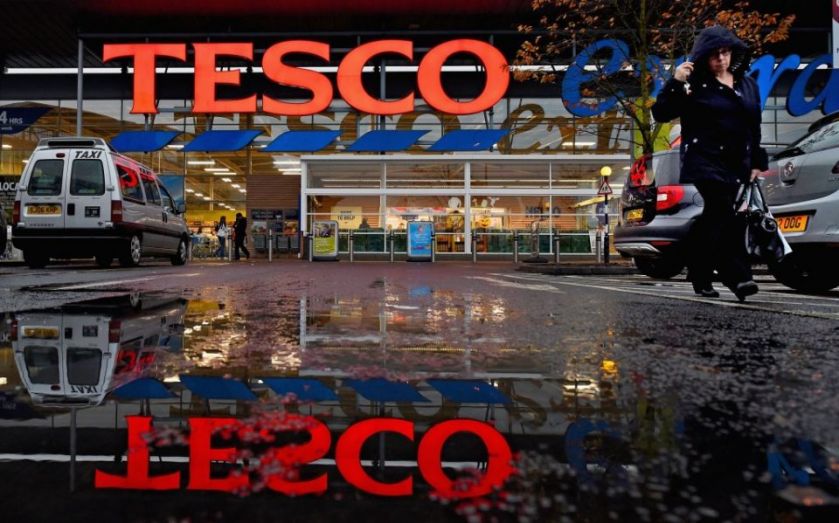
Tesco share price timeline: One chart showing the dramatic decline of the supermarket giant

Since 1919, the rise of Tesco as the dominant supermarket chain has seemed unstoppable. It enjoyed rapid expansion in the 80s and 90s which resulted in a huge market share over the last ten years.
This is all now under threat after a series of profit warnings and scandals has cast a bleak shadow over its future. In the latest blow, Tesco has today warned that its full-year profits will be substantially below market expectations, prompting its share price to fall to an 11-year low.
This chart traces the rise and fall of a business giant (click to view an image which can be zoomed in on mobile).
1919
1924
1934
1947
1955
1960
1974
1977
1979
1982
1985
1993
1994
1995
1997
2000
2003
2005
2007
2009
2010
2011
2012
2013
2014
